Summary
From access reserved to the terminal, where 86% of published data went unviewed, to a graphical interface that links data by provenance, with 94% of data viewed.
From access reserved to the terminal, where 86% of published data went unviewed, to a graphical interface that links data by provenance, with 94% of data viewed.
From access reserved to the terminal, where 86% of published data went unviewed, to a graphical interface that links data by provenance, with 94% of data viewed.
Prototype first
I constantly push stakeholders to build a prototype or a proof of concept before any pure design work, to test the value proposition and the business plan.
Blue Brain Project, EPFL
2022 – 2024
Product Design Lead and frontend engineer
The NISE team, 3 backend engineers, and the computational neuroinformatics and HPC teams
Data viewed from 14% to 94%
86% of published data was never viewed, because it could only be reached through the terminal and an SDK, while scientists mostly wanted to see the links between data.
Refuse to reduce the product to a library search with API endpoints, back that refusal with five years of usage data and qualitative research, then prove feasibility with a test on a 20-neuron circuit.
Data viewed from 14% to 94%, with more than 2,600 active researchers a month.
01
Published data that almost nobody looks at
At the Blue Brain Project, a first usage diagnosis showed that 86% of Fusion’s published data was never viewed. It could only be reached through an SDK or the terminal, while scientists wanted to see the links between data. Internally, some wanted to reduce the product to a search and API endpoints. The full platform ran into three objections: cost, a priority judged lower, and data quality.
02
What I pushed through, negotiated or refused
Some wanted to reduce the product to a library search and API endpoints to copy into a terminal. I defended a real platform, to structure, annotate, link and share data. In two to three meetings, I backed my position with interviews with scientists and five years of API requests, which showed the terminal was rarely used. I also refused to launch simulations from the web app: that called for a full application of its own, with its parameters and data validation before each simulation.
03
From project lists with no landmarks to exploration by data type and by provenance
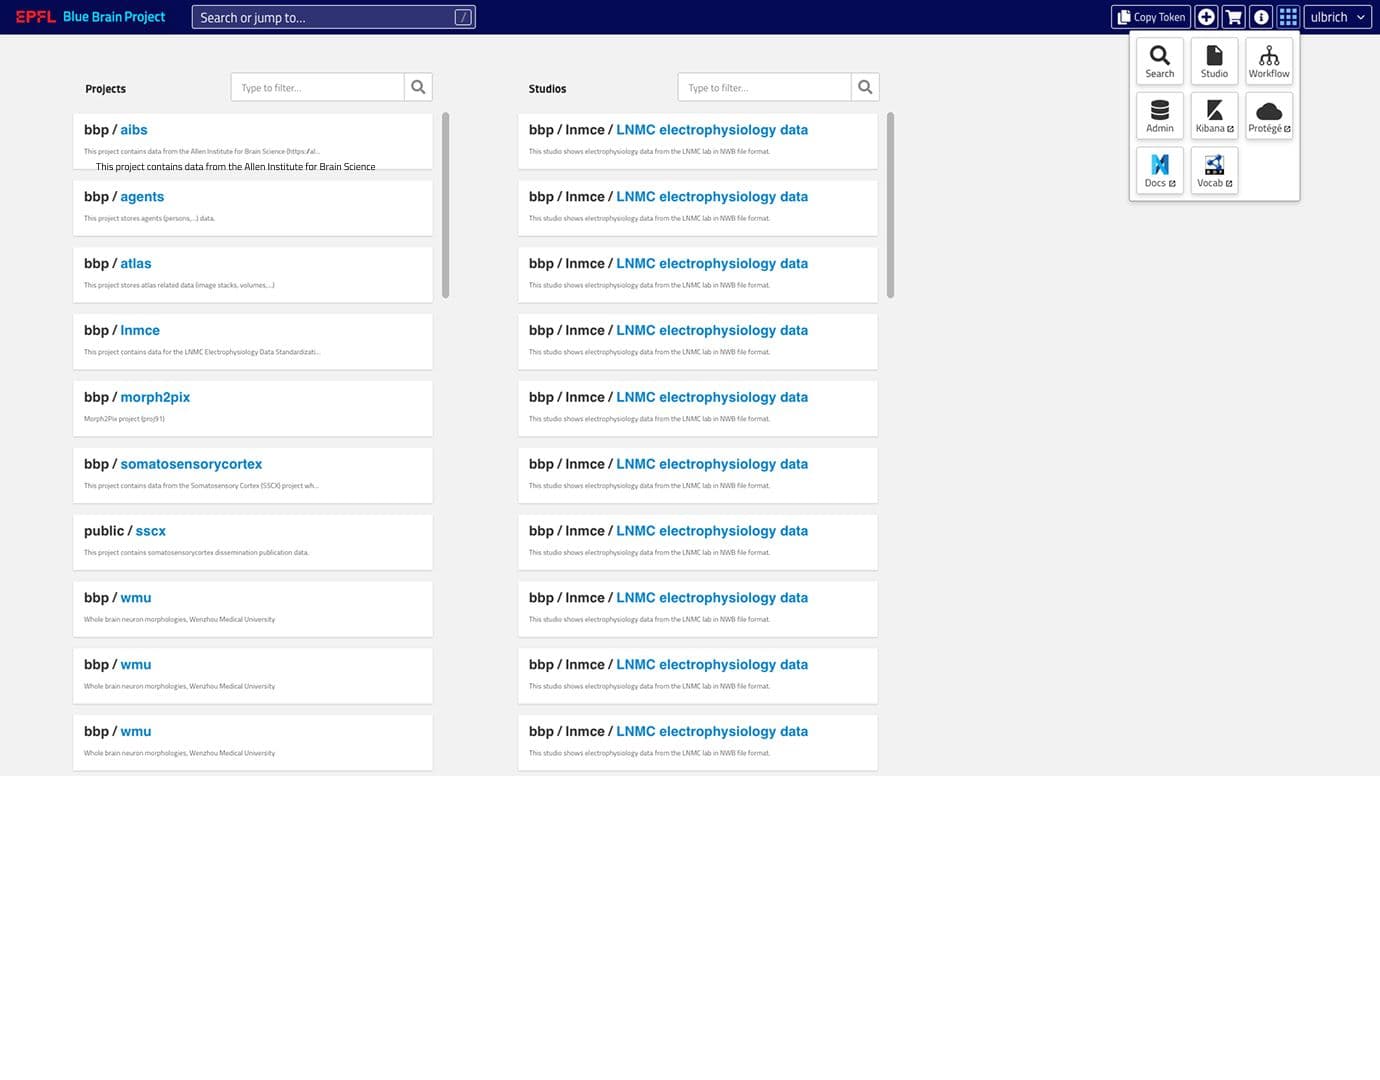
The two long lists of projects and studies, where entries repeat identically.
The menu of scattered tools (Search, Studio, Workflow, Admin, Kibana…).
Search by data type (morphologies, electrophysiologies, simulations…), with the number of datasets.
Pinned items.
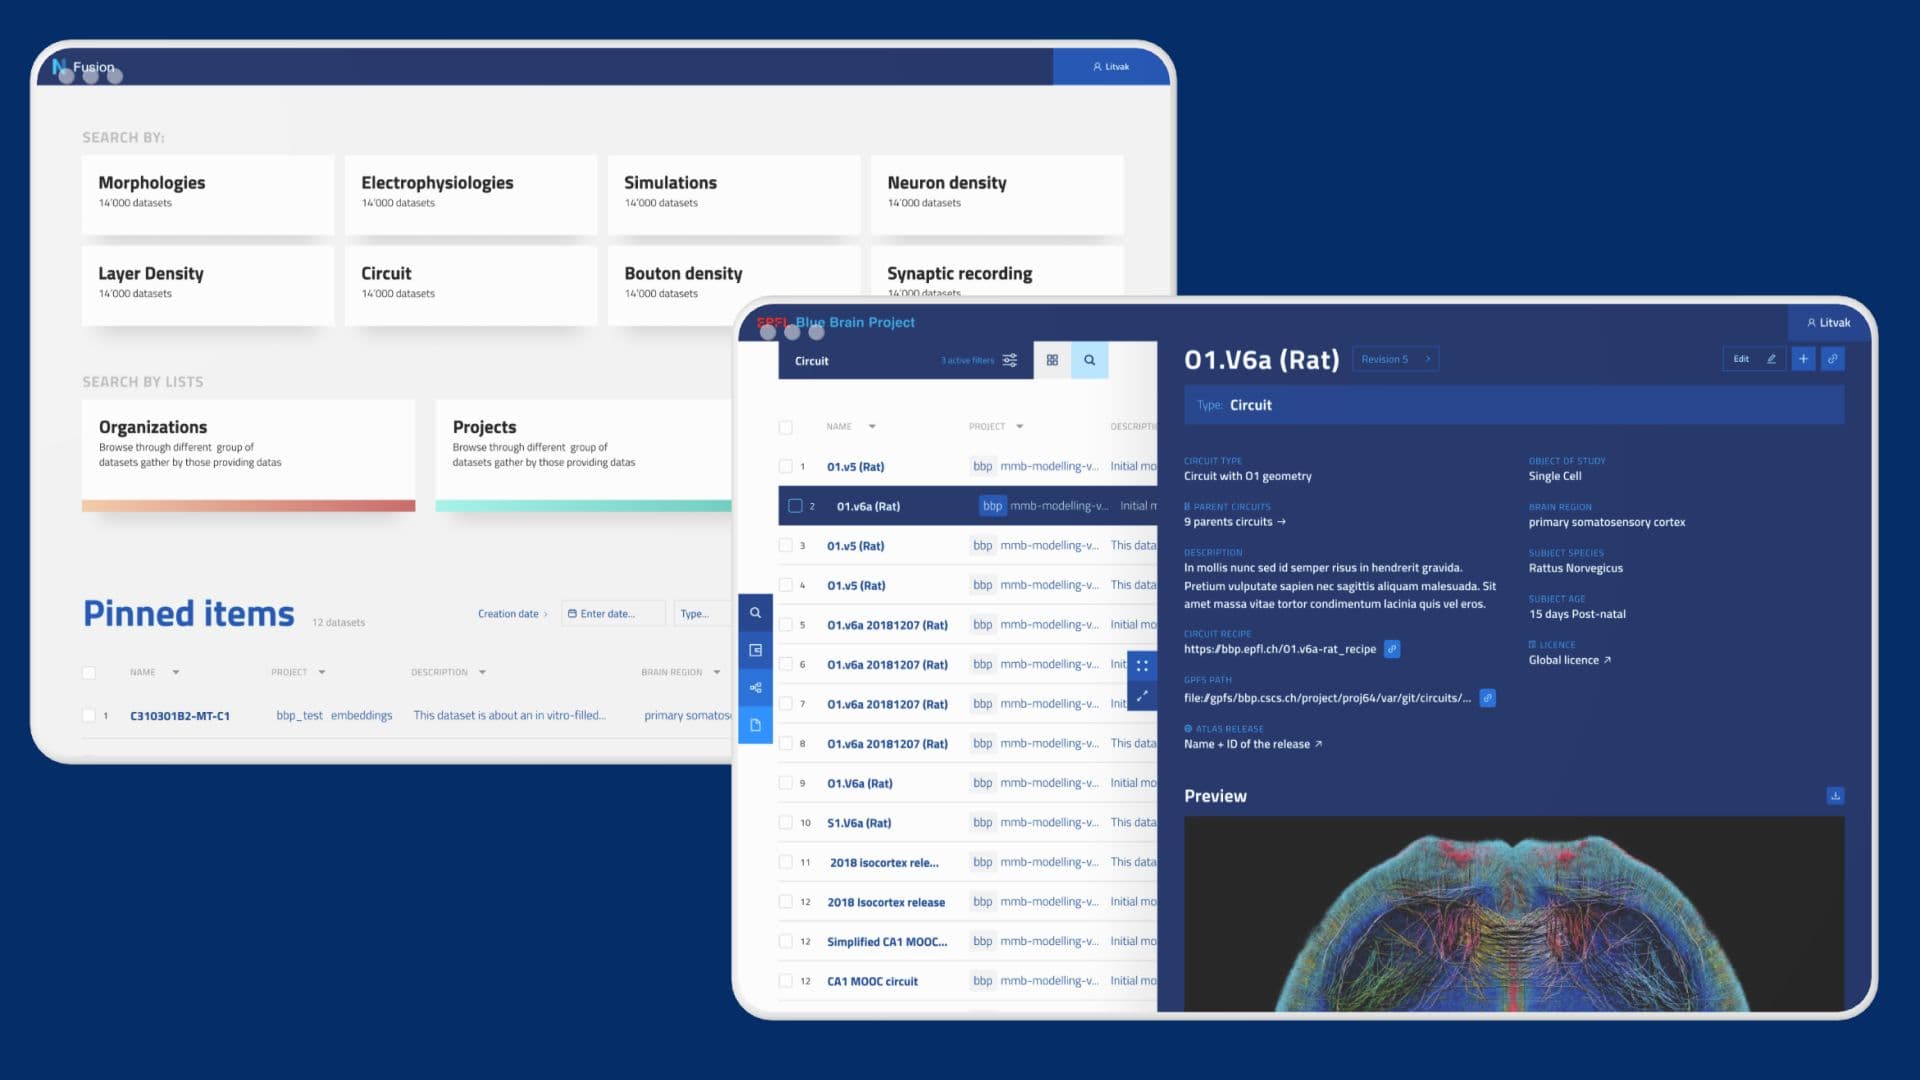
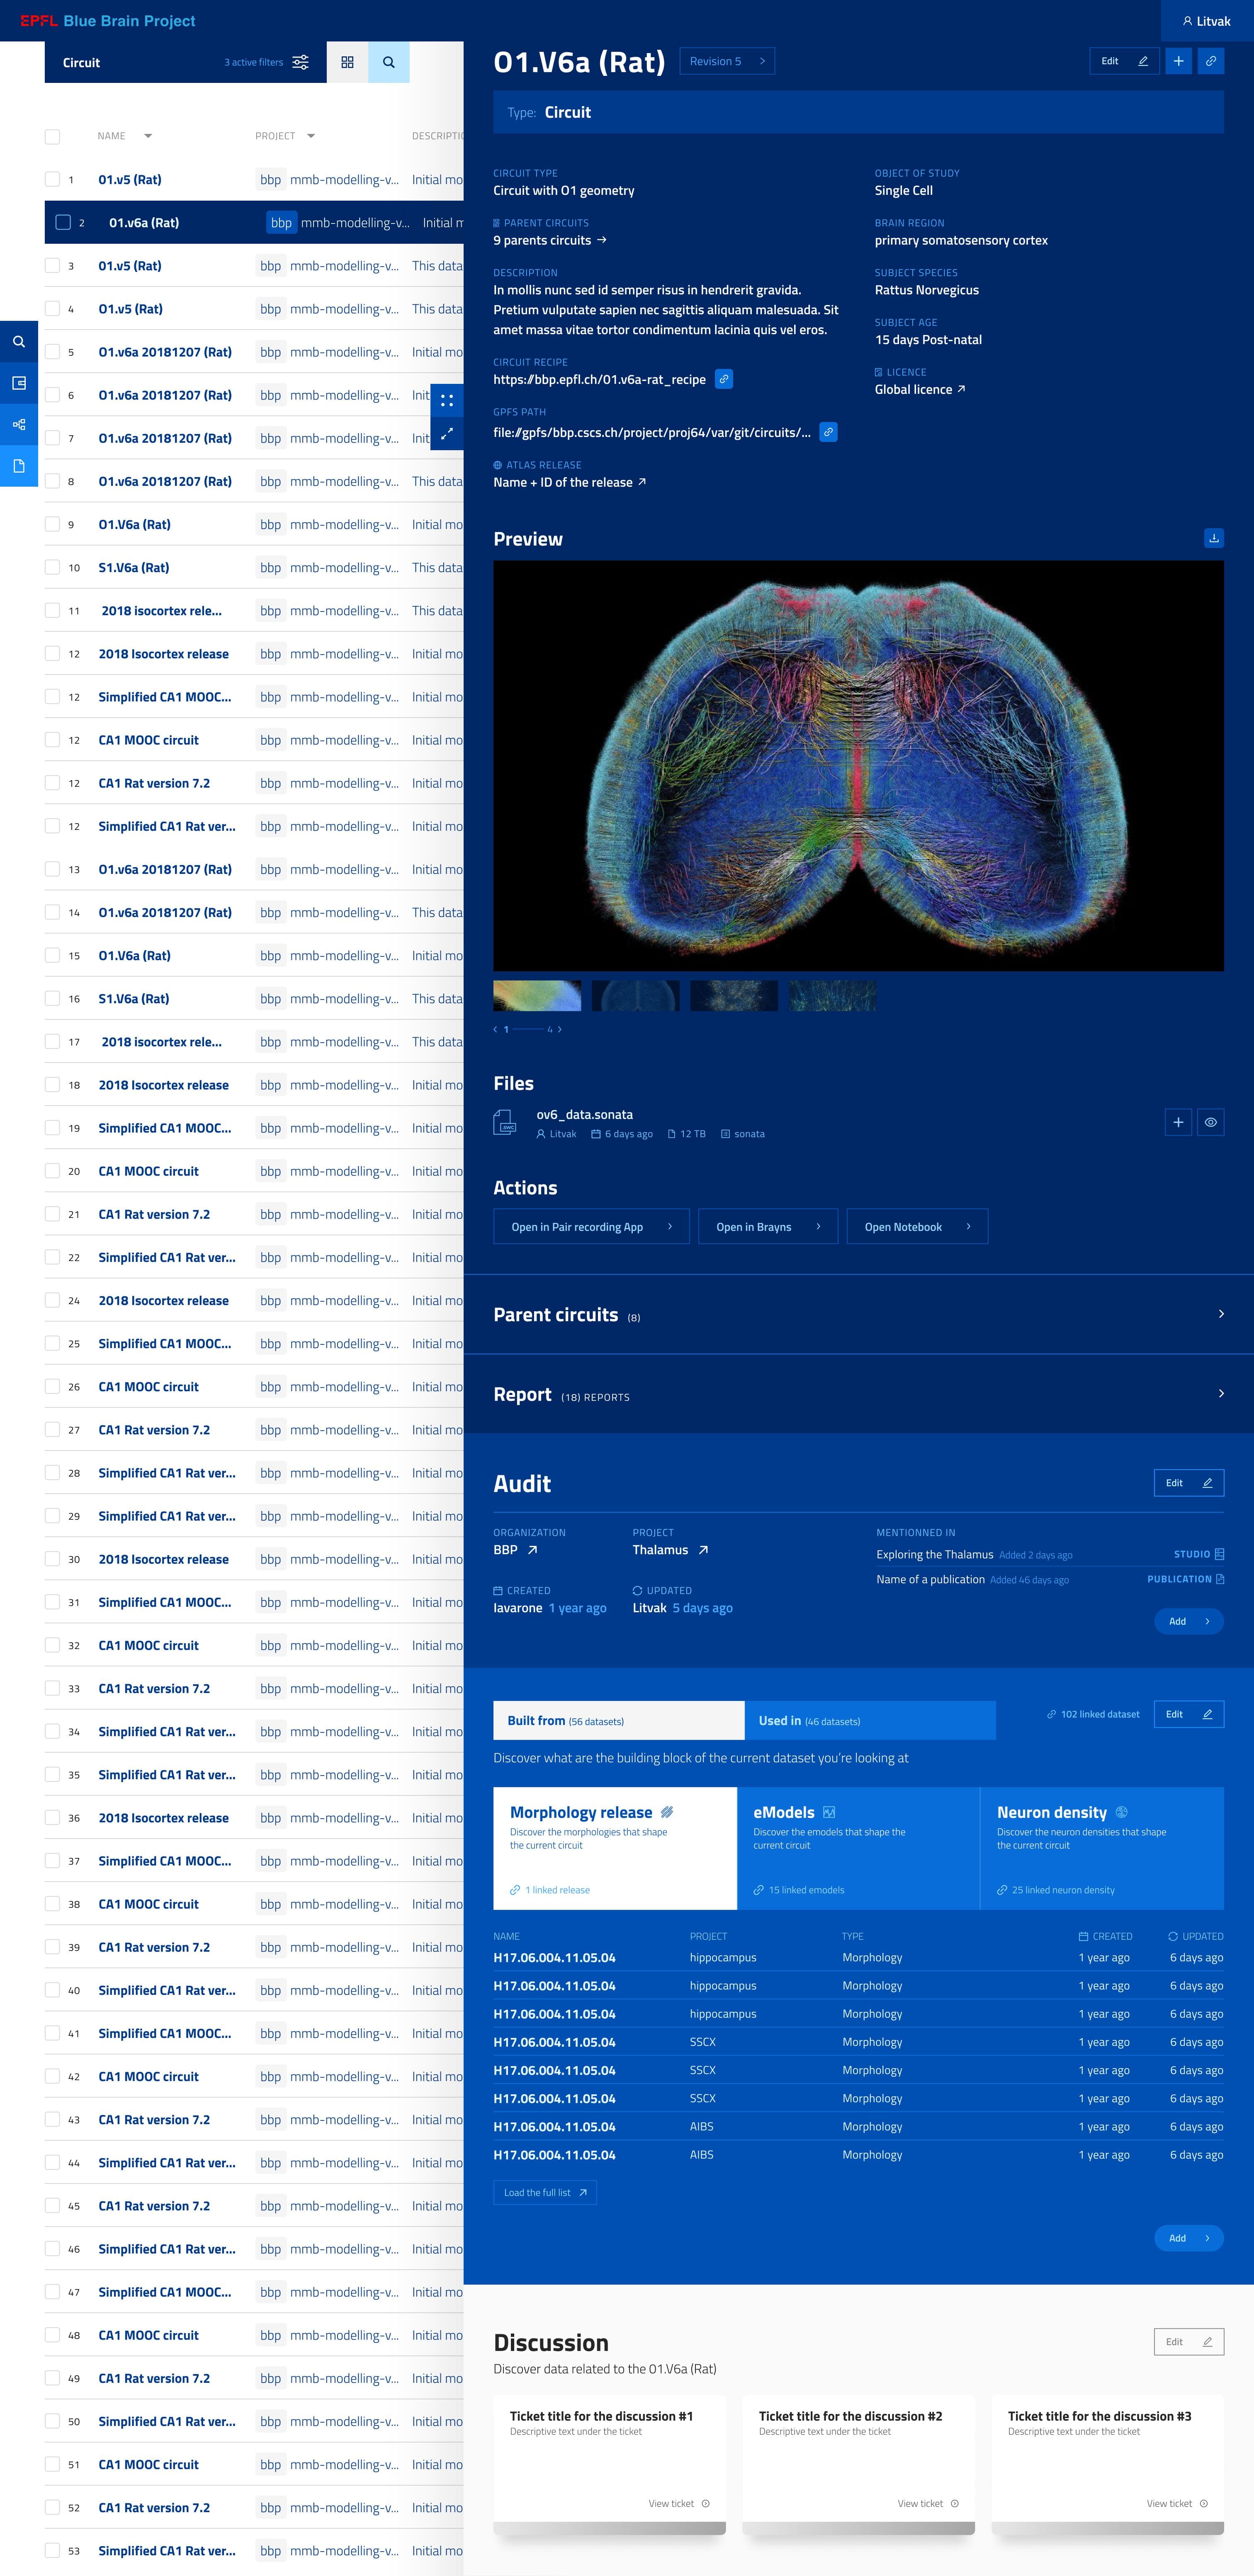
The circuit preview.
The “Built from” and “Used in” blocks with their linked datasets.
04
The measurable value generated for research
Data viewed up from 14% to 94%.
More than 2,600 active researchers a month on the web app.
More than 12,000 reports, 20,000 experimental data items and 150 studios published.
A contested proposal became a proof of concept approved by four team leads, validated on real data.
05
What I learned and how mature I am
I would have added a data curation console, used by the BBP curation team, to show the life cycle of a piece of data rather than a frozen image. Users wanted to know when data had been created or updated, but time and people were short, so I left it aside.
I learned that usage data settles things better than opinions: five years of API requests and qualitative research resolved a debate that a designer’s opinion would not have.
One point remains open: the feasibility of the relations module at the scale of millions of resources, and getting it into production.

