Summary
Turning brain models that were hard to read and to connect into a single platform to explore, simulate and validate them, adopted by more than 1,200 labs.
Turning brain models that were hard to read and to connect into a single platform to explore, simulate and validate them, adopted by more than 1,200 labs.
Turning brain models that were hard to read and to connect into a single platform to explore, simulate and validate them, adopted by more than 1,200 labs.
Prototype first
I constantly push stakeholders to build a prototype or a proof of concept before any pure design work, to test the value proposition and the business plan.
Open Brain Institute (spun out of the Blue Brain Project, EPFL)
2022 – 2026
Sole product designer, product owner of the Virtual Lab, Help & Feedback and Reports, and frontend engineer
32 people (142 at the start): 18 scientists, 4 full-stack, 4 backend, 3 in visualization, 2 in HPC
Circuit viewer bounce rate from 86% to 8%
An imprecise 3D brain with no connectivity, large circuits that were unreadable, provenance limited to a single level. The result: an 86% bounce rate on the circuit viewer, with users taking screenshots and contacting support.
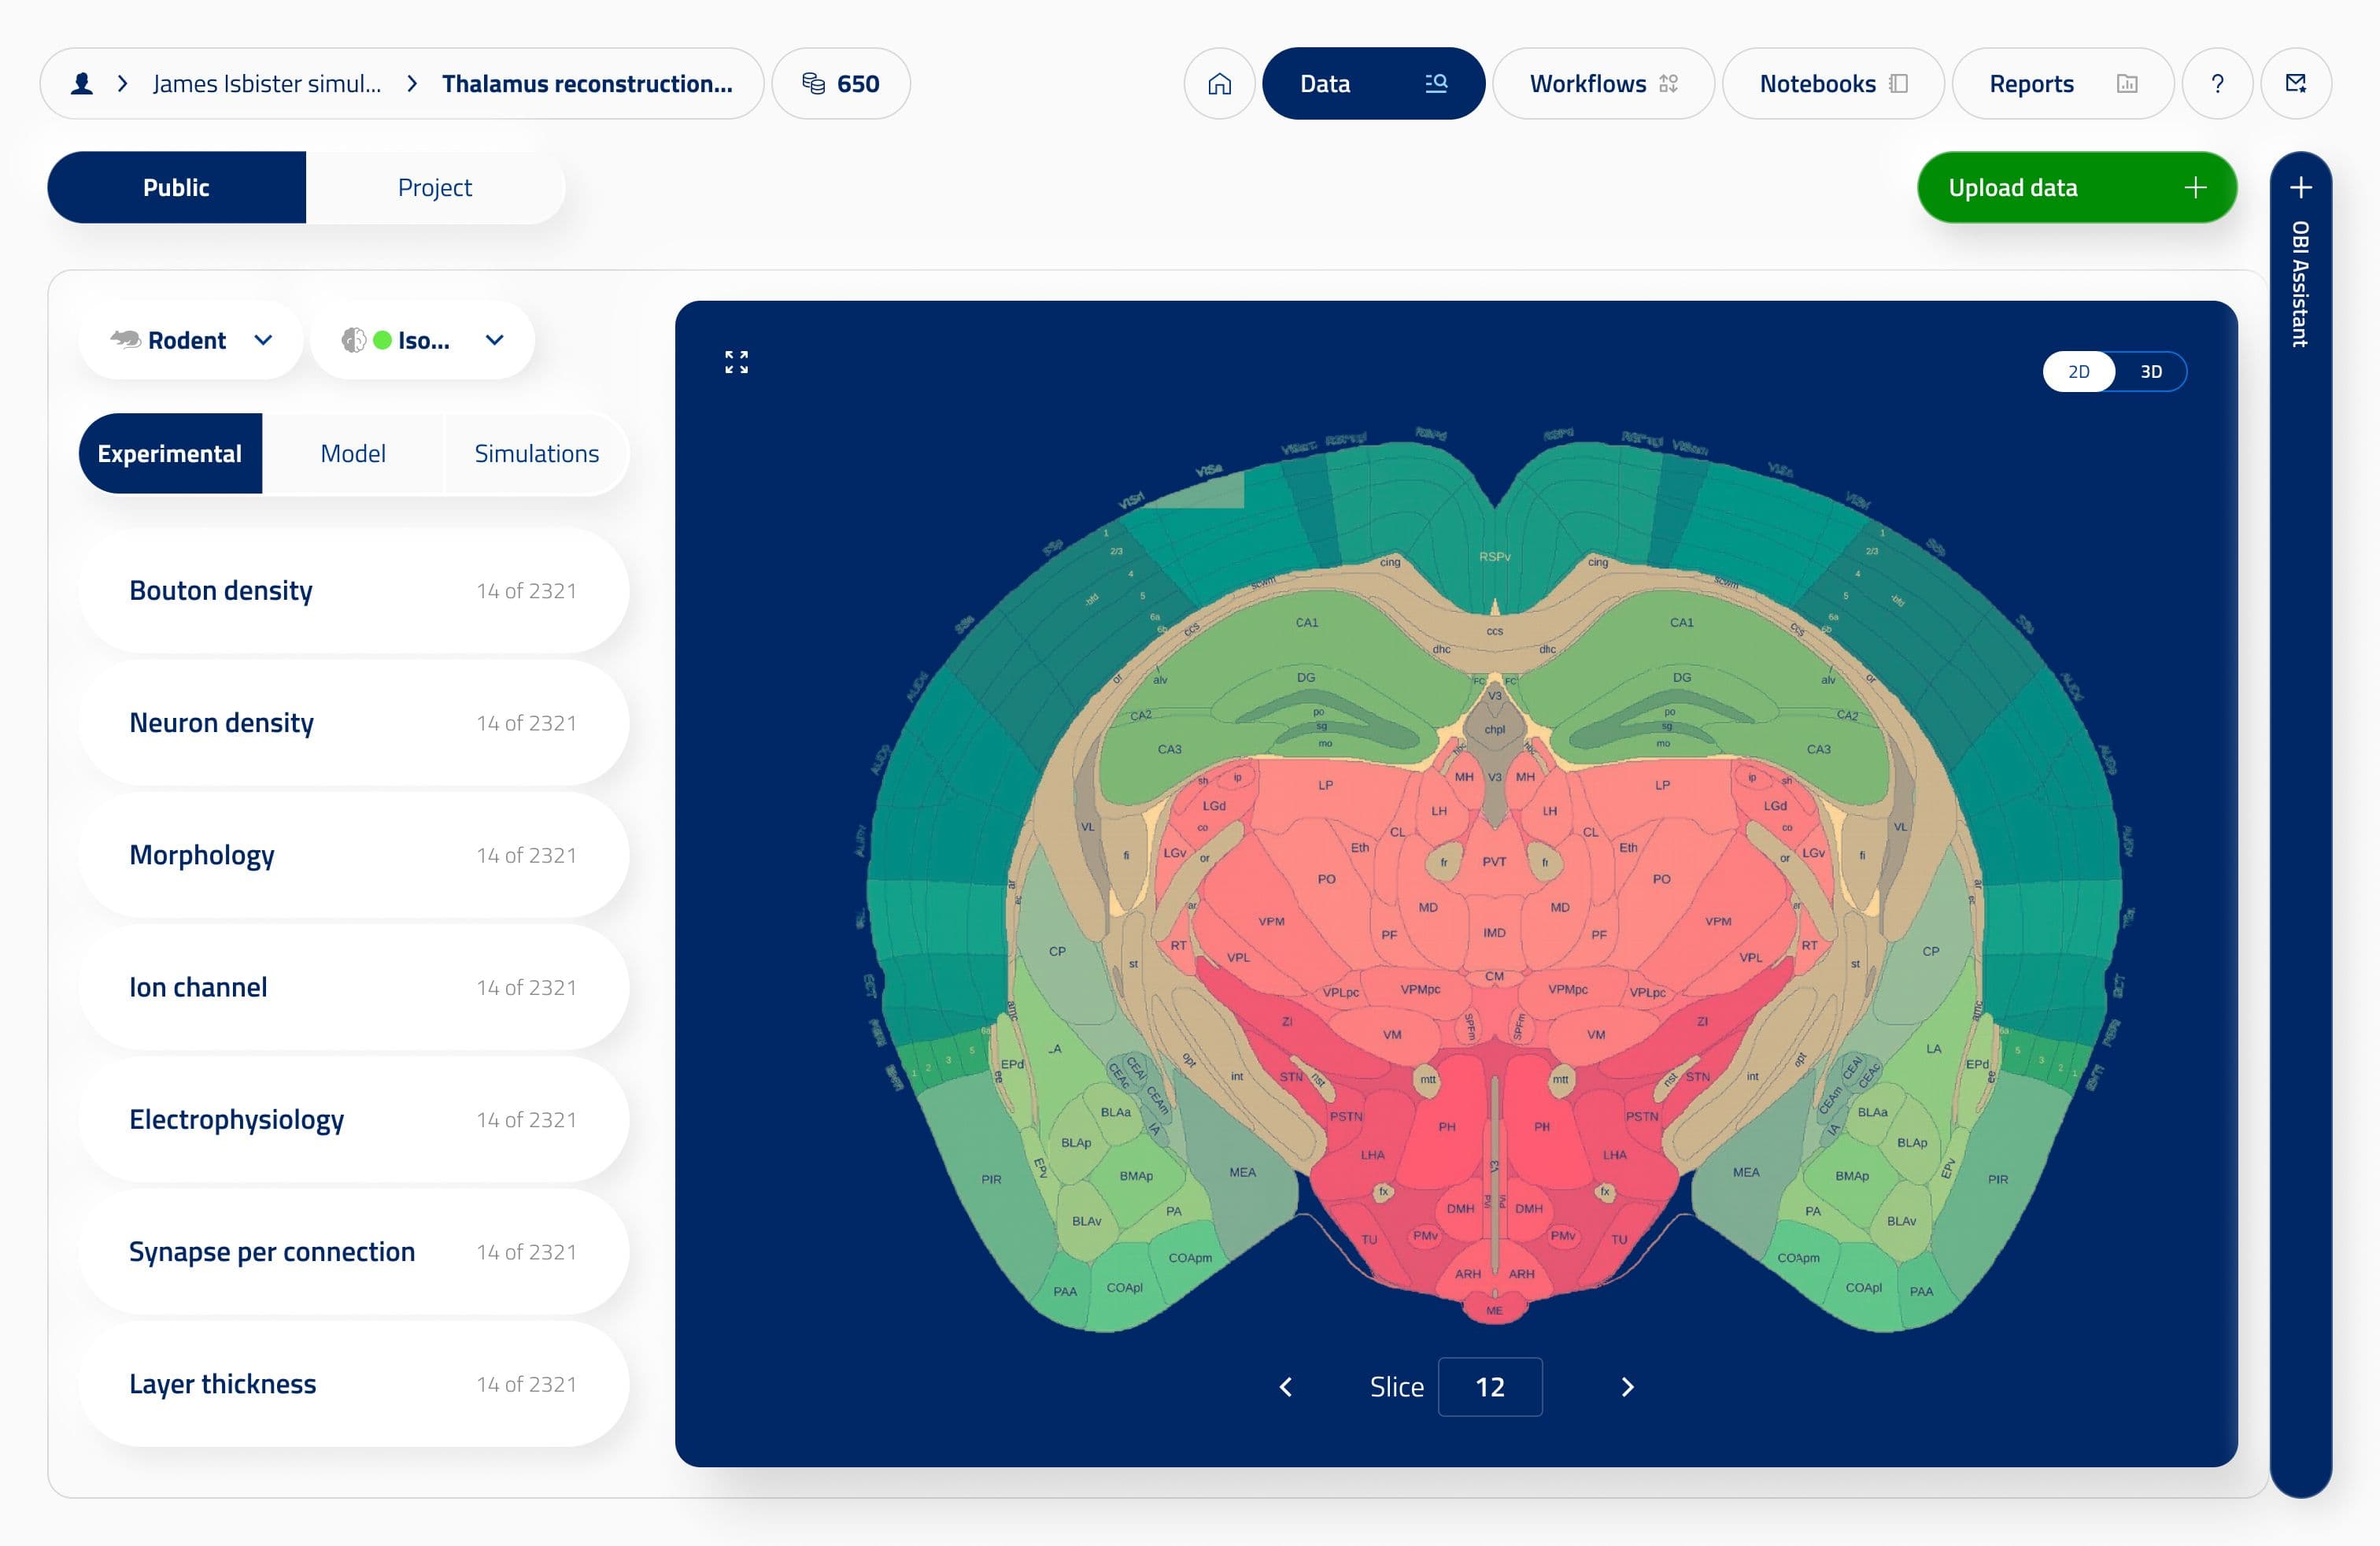
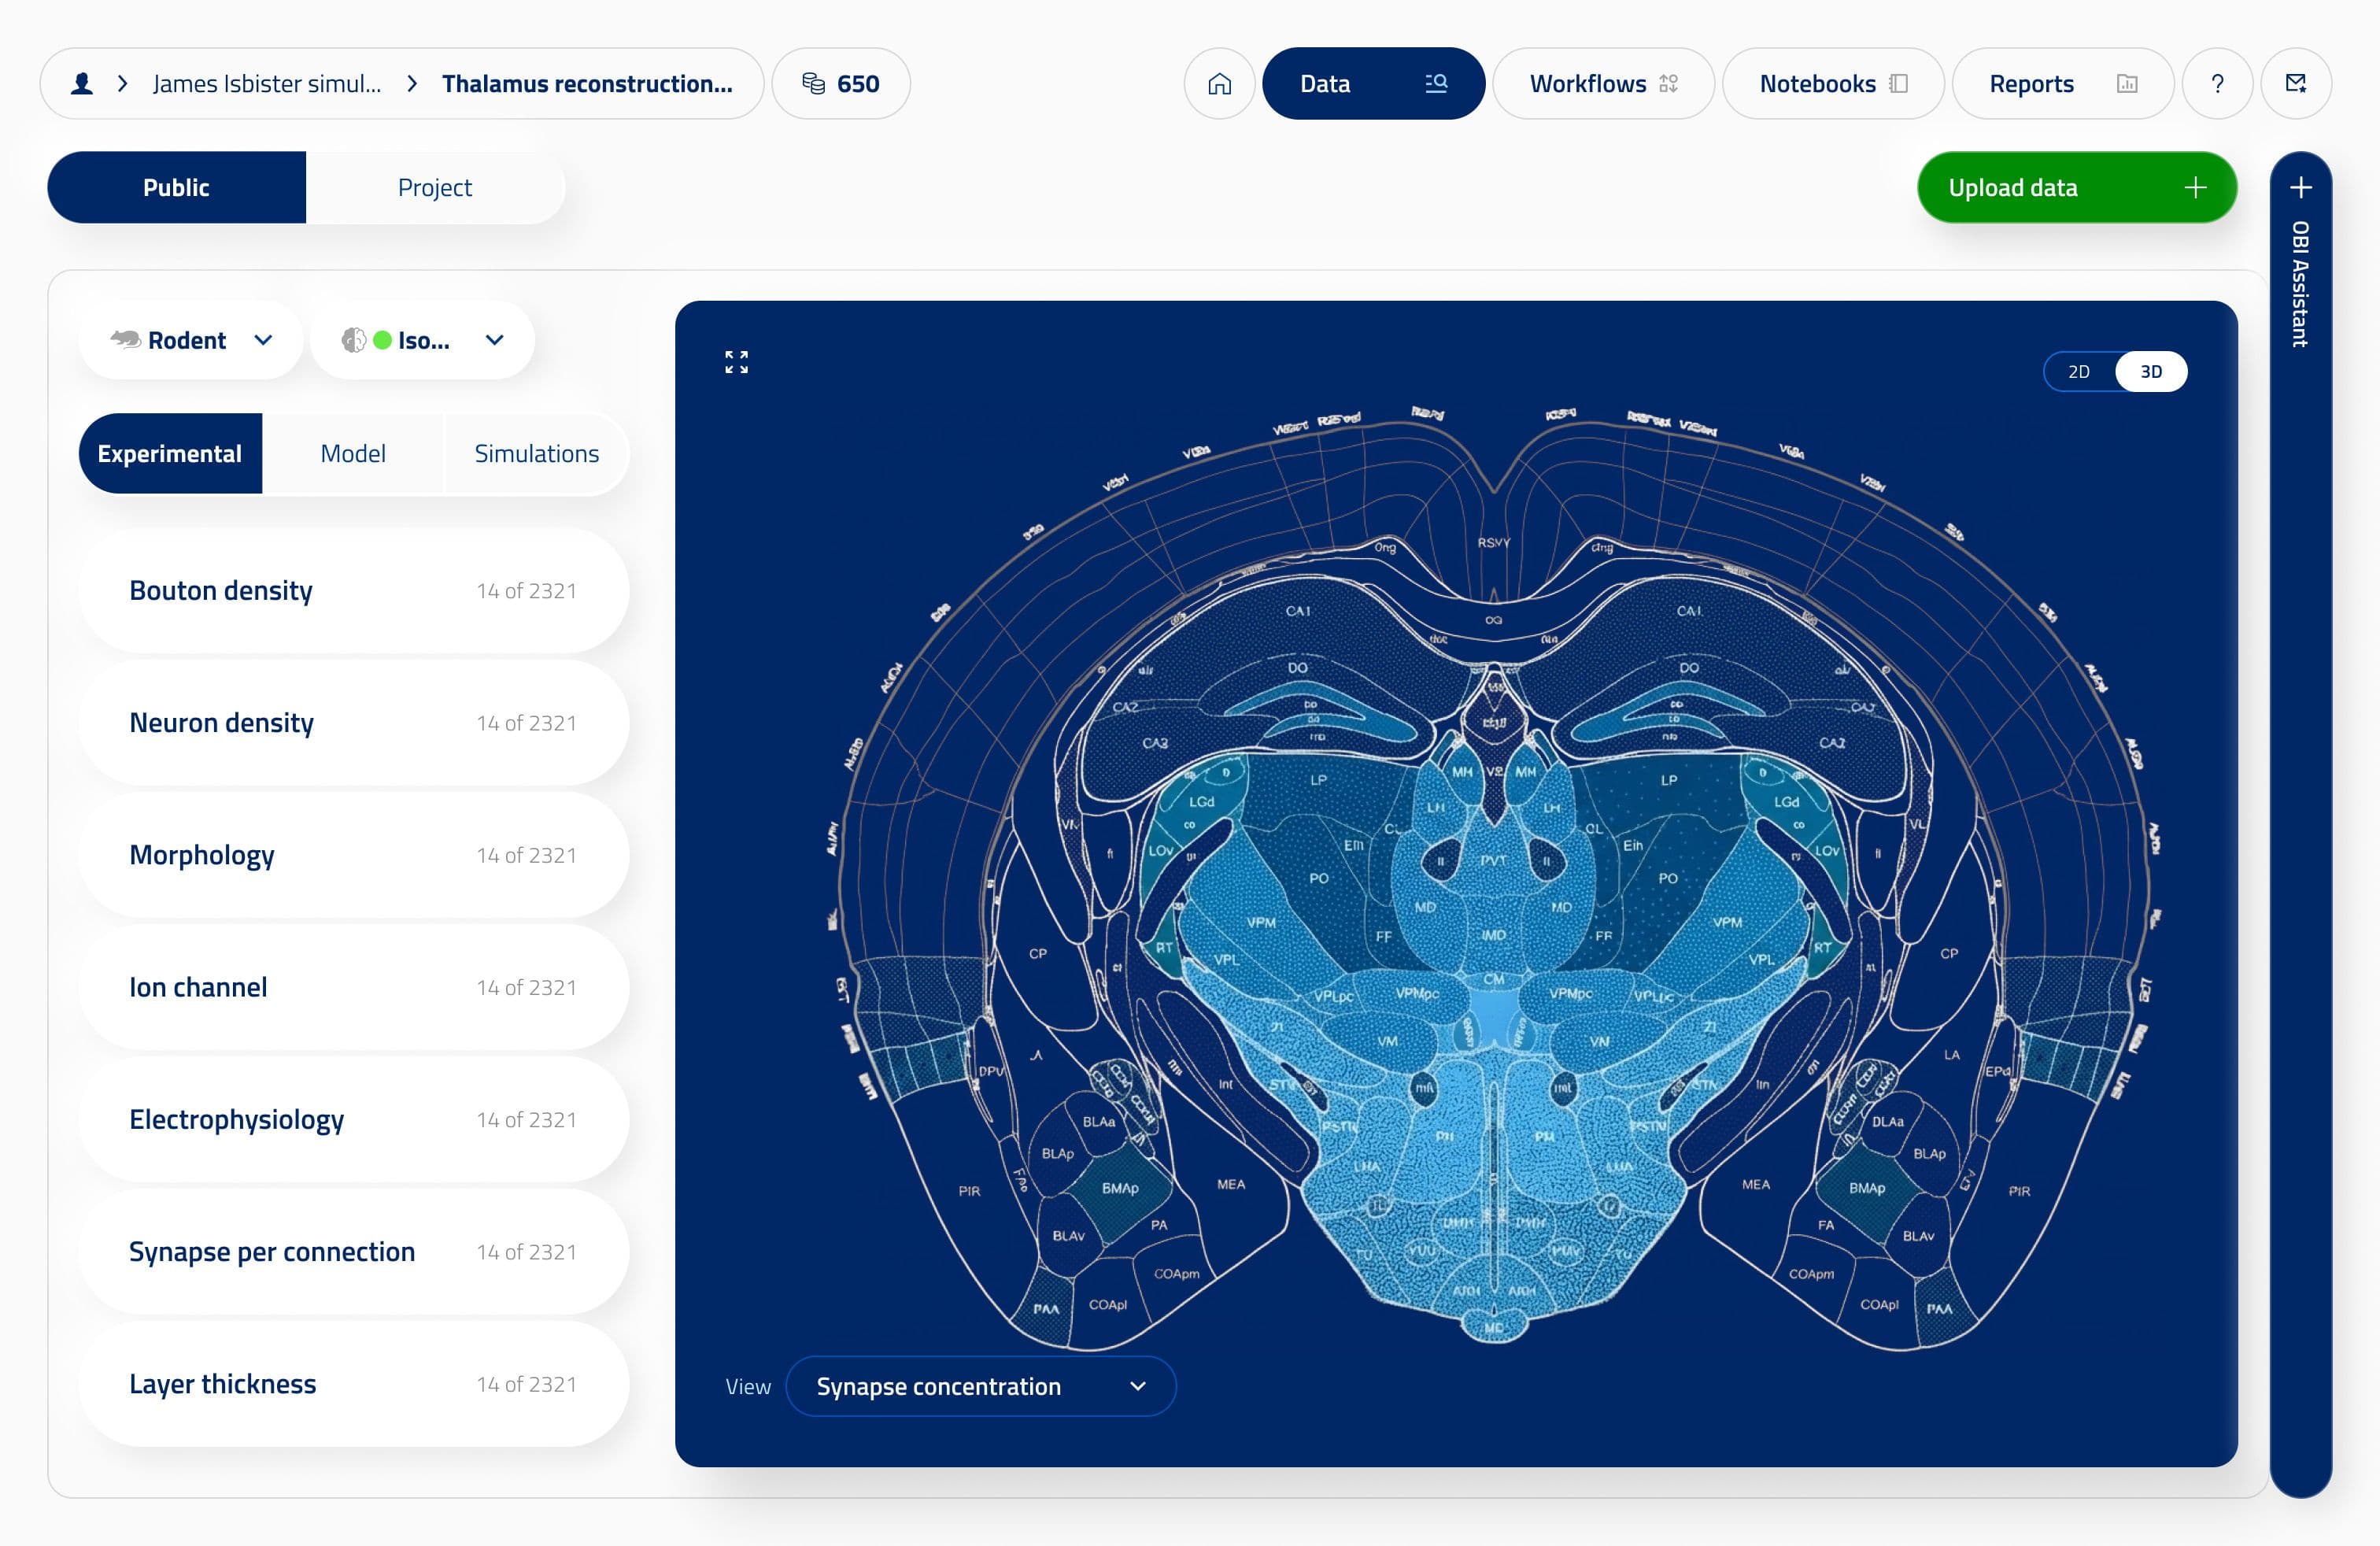
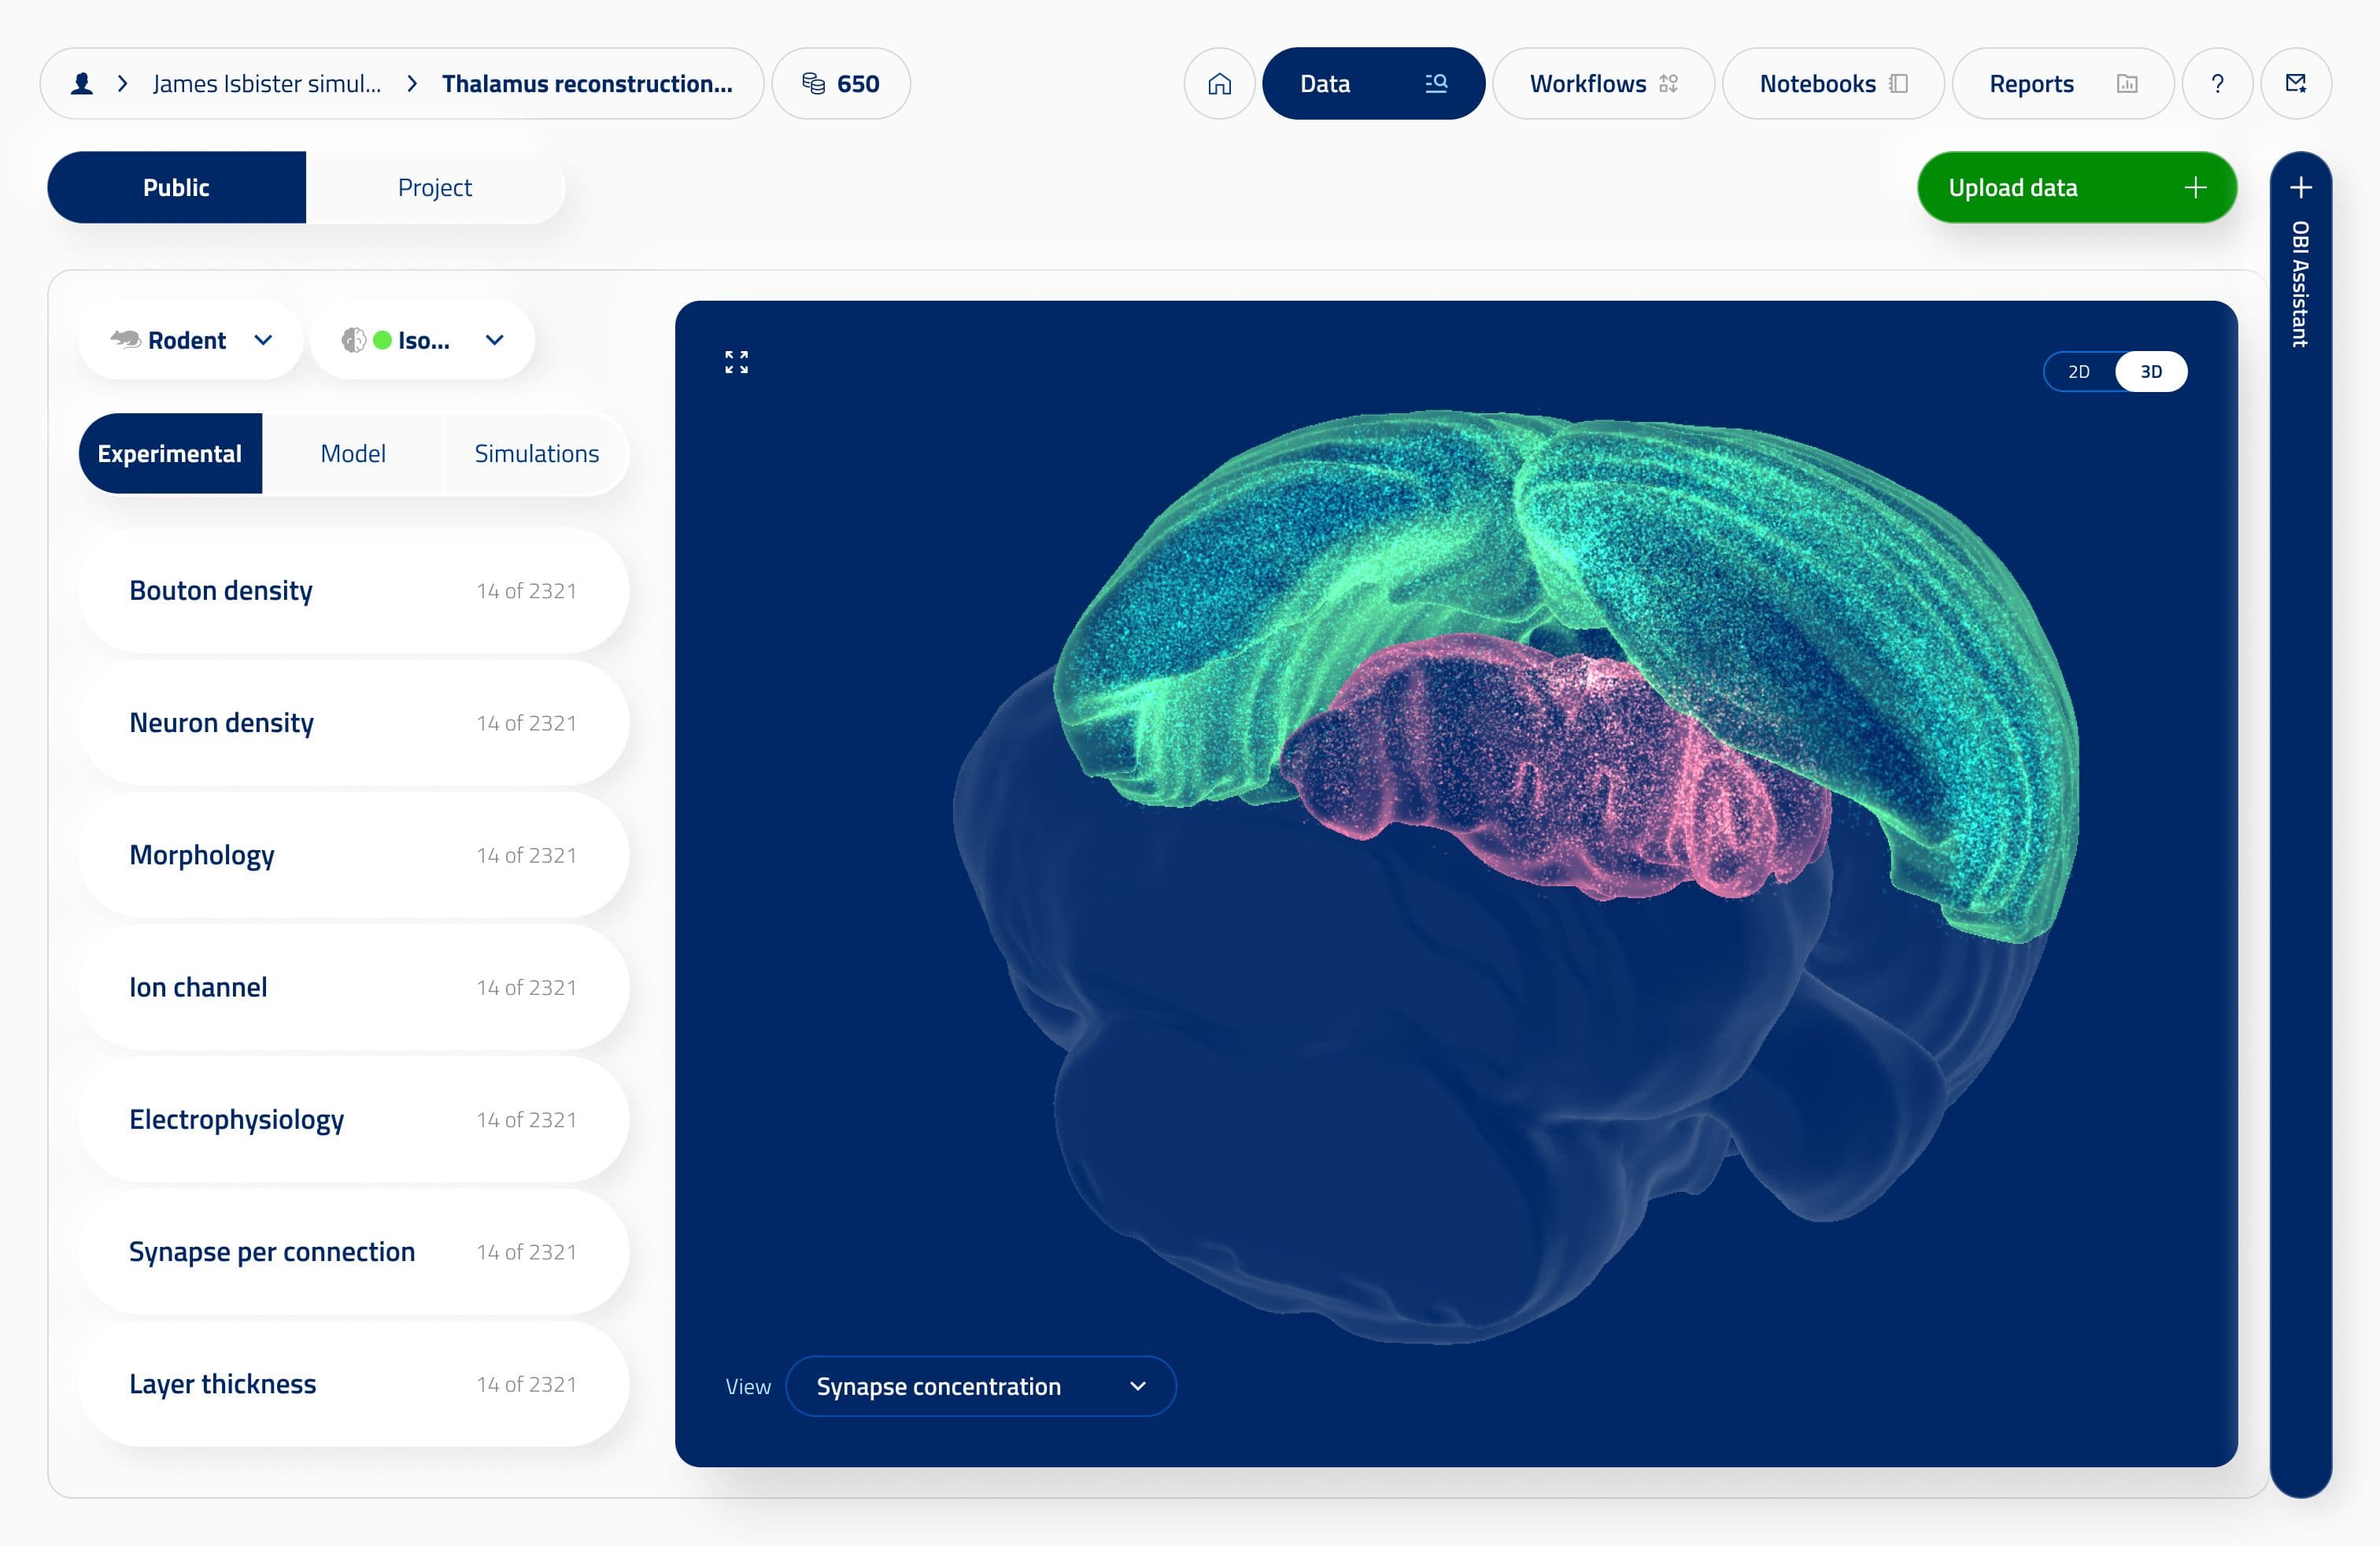
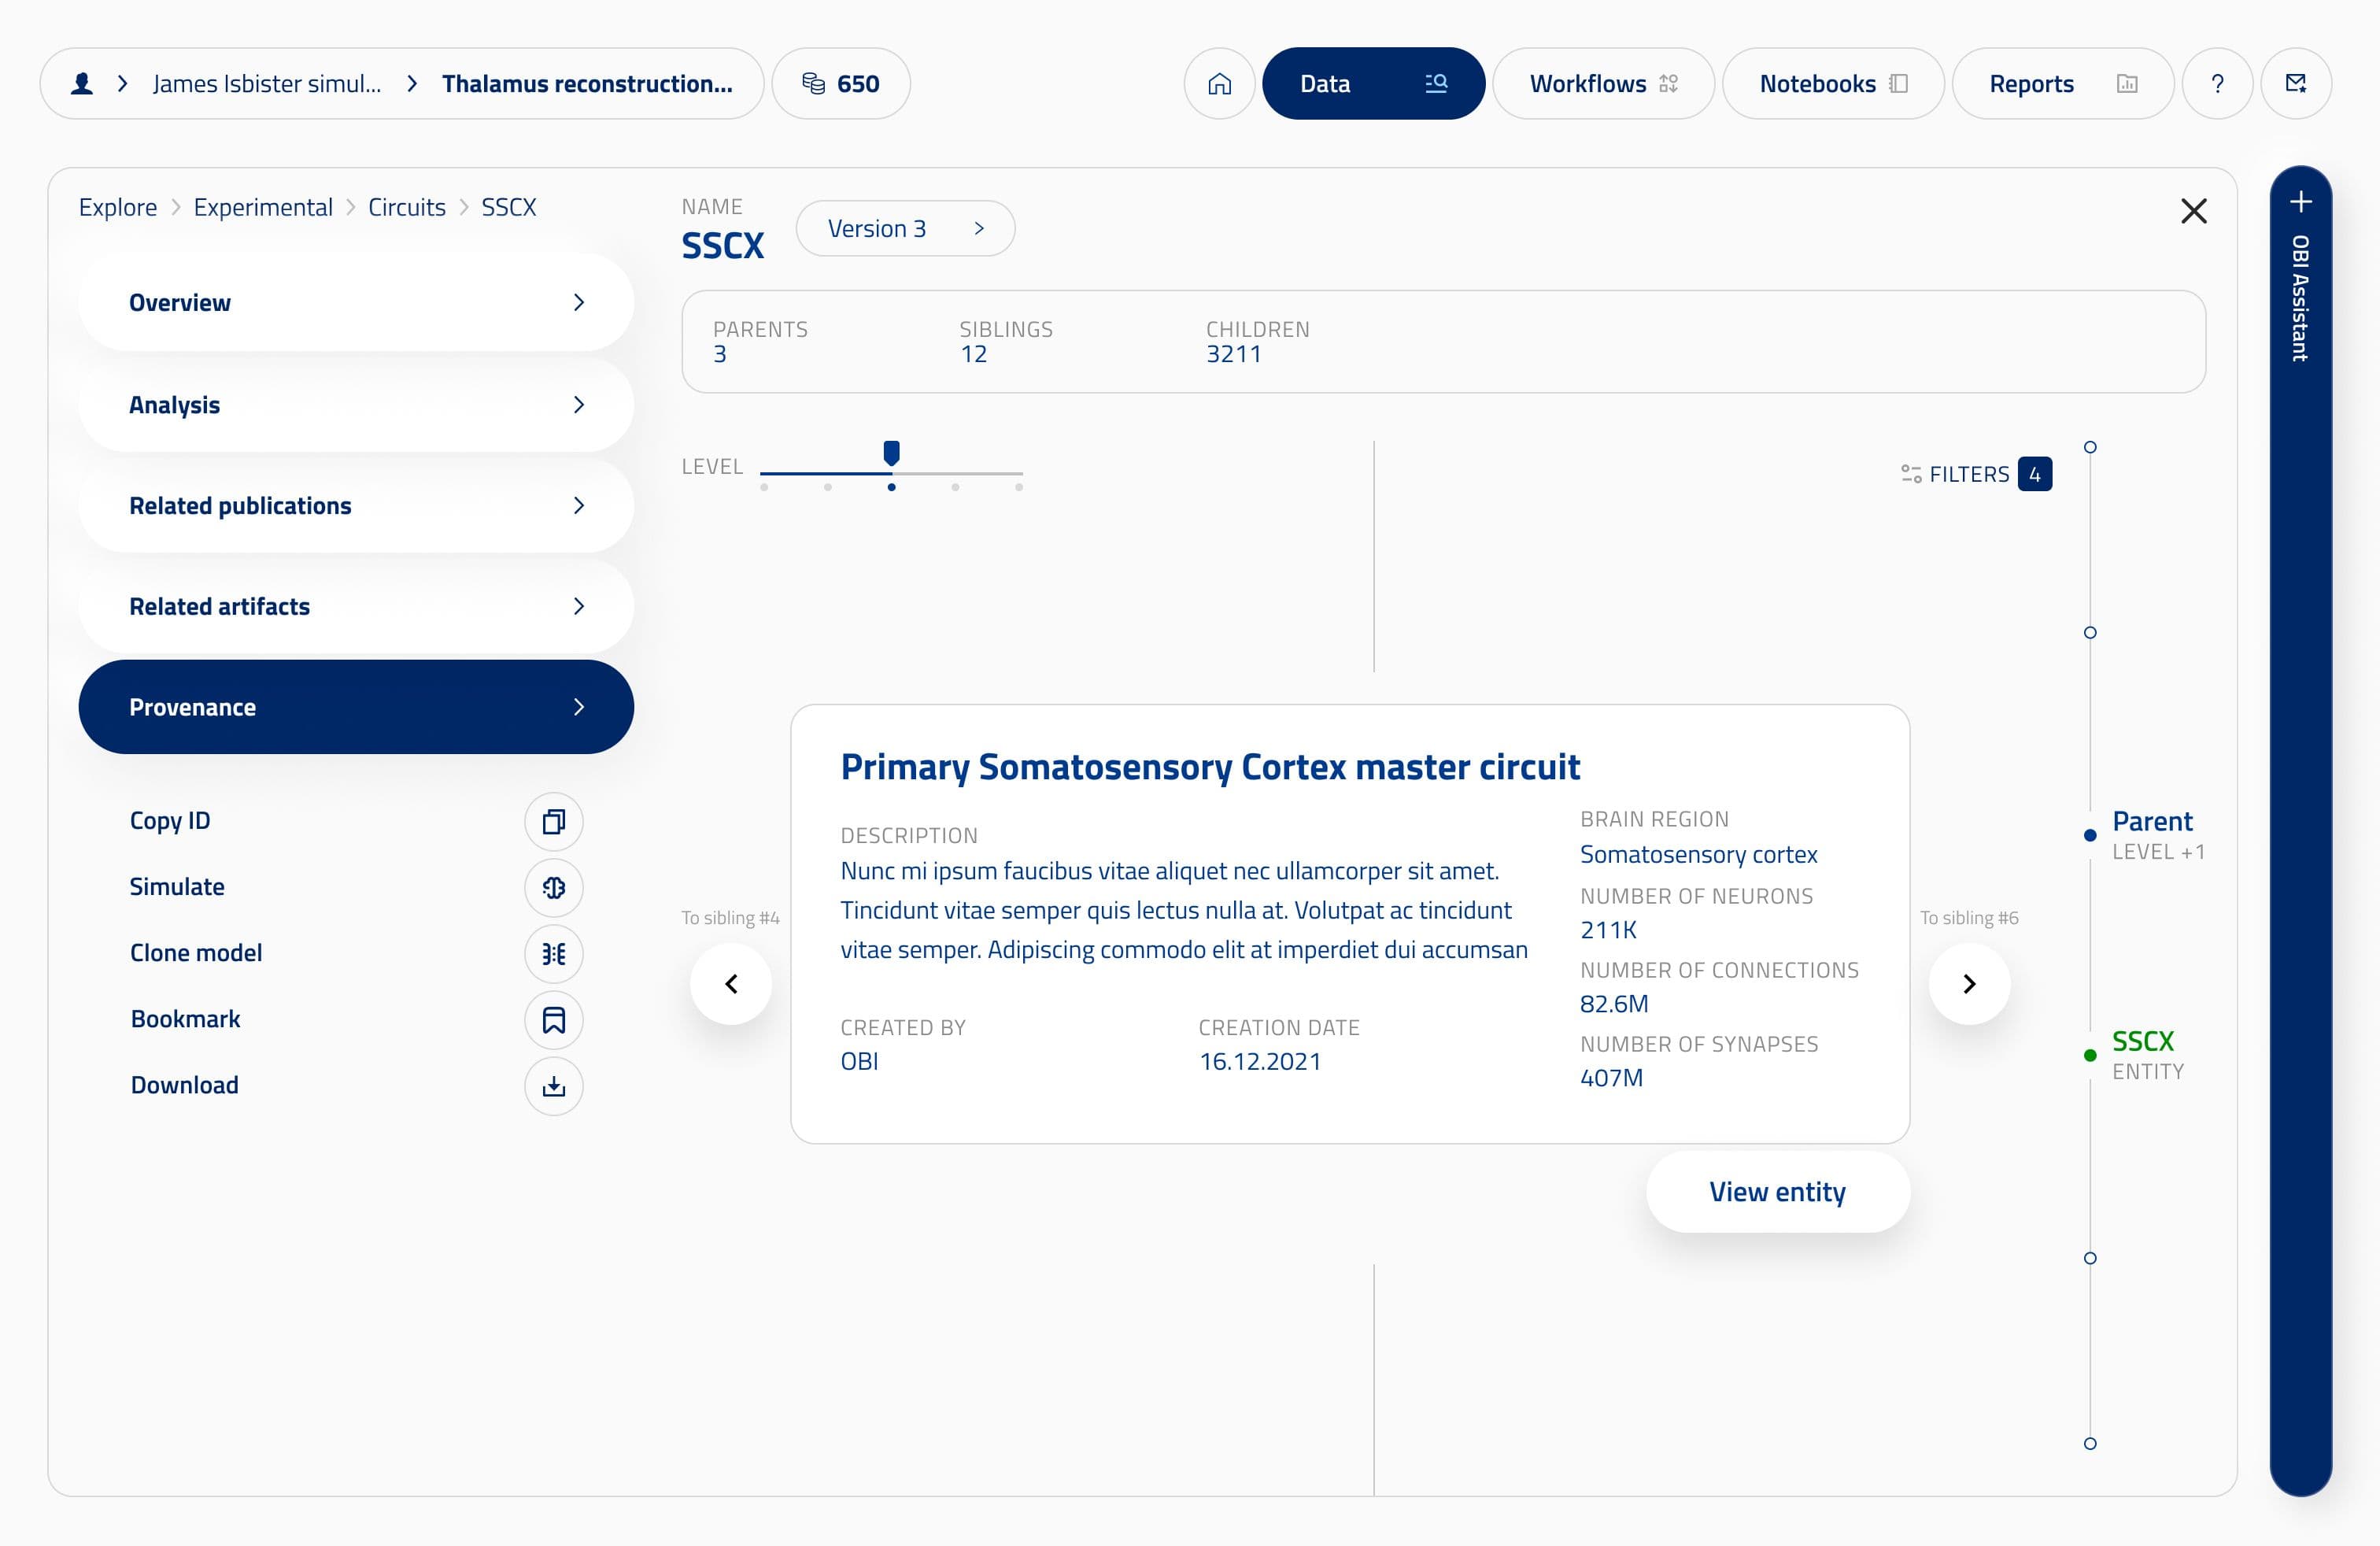
Replace the 3D with a layer-by-layer 2D view, add display modes that each answer one question at a time, and an interactive provenance map.
Bounce rate from 86% to 8%, and more than 1,200 virtual labs in 18 months against a target of 600 a year.
01
A platform to launch from scratch, with a small team and a survival target
In 2022, EPFL’s Blue Brain Project became the Open Brain Institute, and the team went from 142 to 32 people. The public launch took place in March 2025, with no labs and no partners. To survive, the institute had to gather 600 virtual labs a year. Yet the circuit viewer put people off: an imprecise 3D brain, unreadable circuits, an 86% bounce rate. I worked on it as the only designer, with a product owner’s responsibilities.
02
What I pushed through, negotiated or refused
I refused to add guests to virtual labs. A lab stays a space for administration and budget, and members join projects: opening access to guests would have blurred those responsibilities. I also said no to complex case studies on the home page. Trade-offs were made every week with the scientific leads and the CTO, in a Friday ticket defense, using RICE and impact/effort as the grid.
03
From brain models that were hard to read to a guided exploration, one question at a time
The 2D/3D selector (2D is active).
Slice navigation (“Slice 12”).
Labeled, colored regions, readable one by one.
The “View: Synapse concentration” menu that changes how the same circuit reads.
The switch from the 2D slice to the colored 3D view.
The parent (3), sibling (12) and child (3,211) counters.
The level slider.
Navigation between siblings.
04
The measurable value generated for the institute
Circuit viewer bounce rate down from 86% to 8% (Matomo).
More than 1,200 virtual labs created in 18 months, against a target of 600 a year, with 12 partner universities.
Imported entities up from 2,100 to more than 30,000, thanks to the data validator.
A biological data company partnered with the institute to enrich the 2D views.
Thanks for the default 2D, requests for further features such as dendrograms, and usability is no longer raised in workshops.
05
What I learned and how mature I am
Today, I would build the onboarding of each workflow backwards from the outcome: a conversation with the OBI assistant about a real publication, then the way back to what produced its results and artifacts.
In the notebooks, I proposed built-in tips that point to the platform’s native tools. I would have pushed them earlier, because notebooks are a way into an environment that researchers already know.

