+12%Users
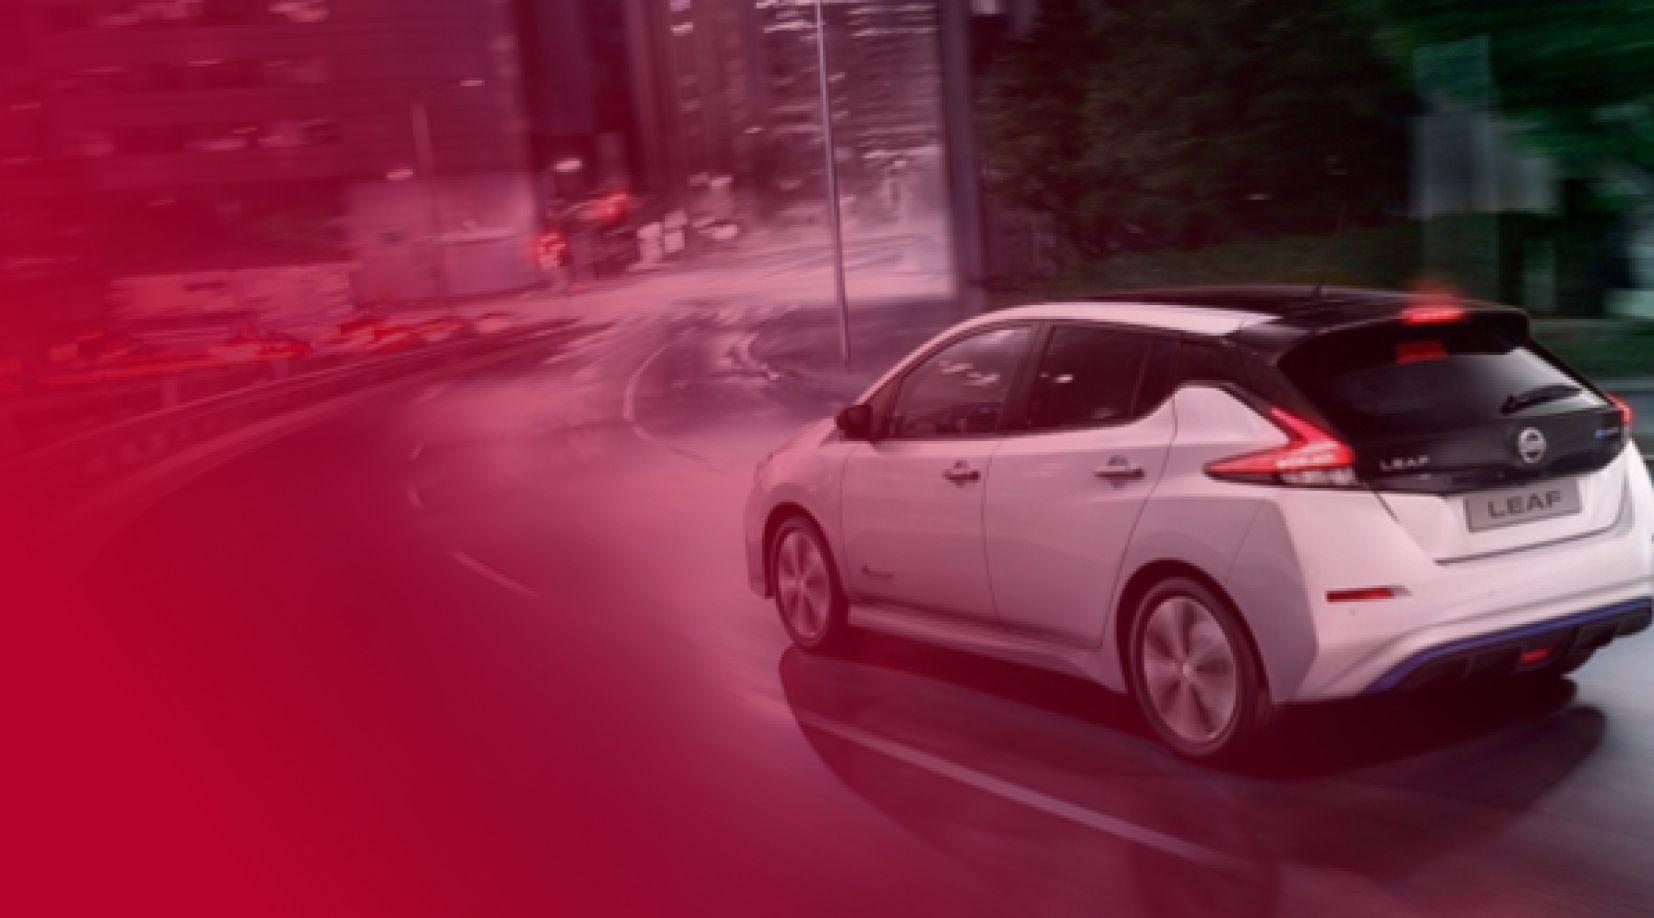
My work with the ACMS teams on two new Nissan applications contributed to this increase.
One app for drivers to manage their thermal or electric Nissan
Role
Product Design · User Research · Motion Design
+12%Users
My work with the ACMS teams on two new Nissan applications contributed to this increase.
3 monthsOf research
Research, analysis and user interviews before and during design.
Product design and user research.
Tokyo and Paris, with the ACMS teams.
User interviews, assumption mapping, interactive prototypes, screen tests with attention heatmaps, and workshops with stakeholders and engineers.
01
Thermal and electric vehicles, different models, one application.
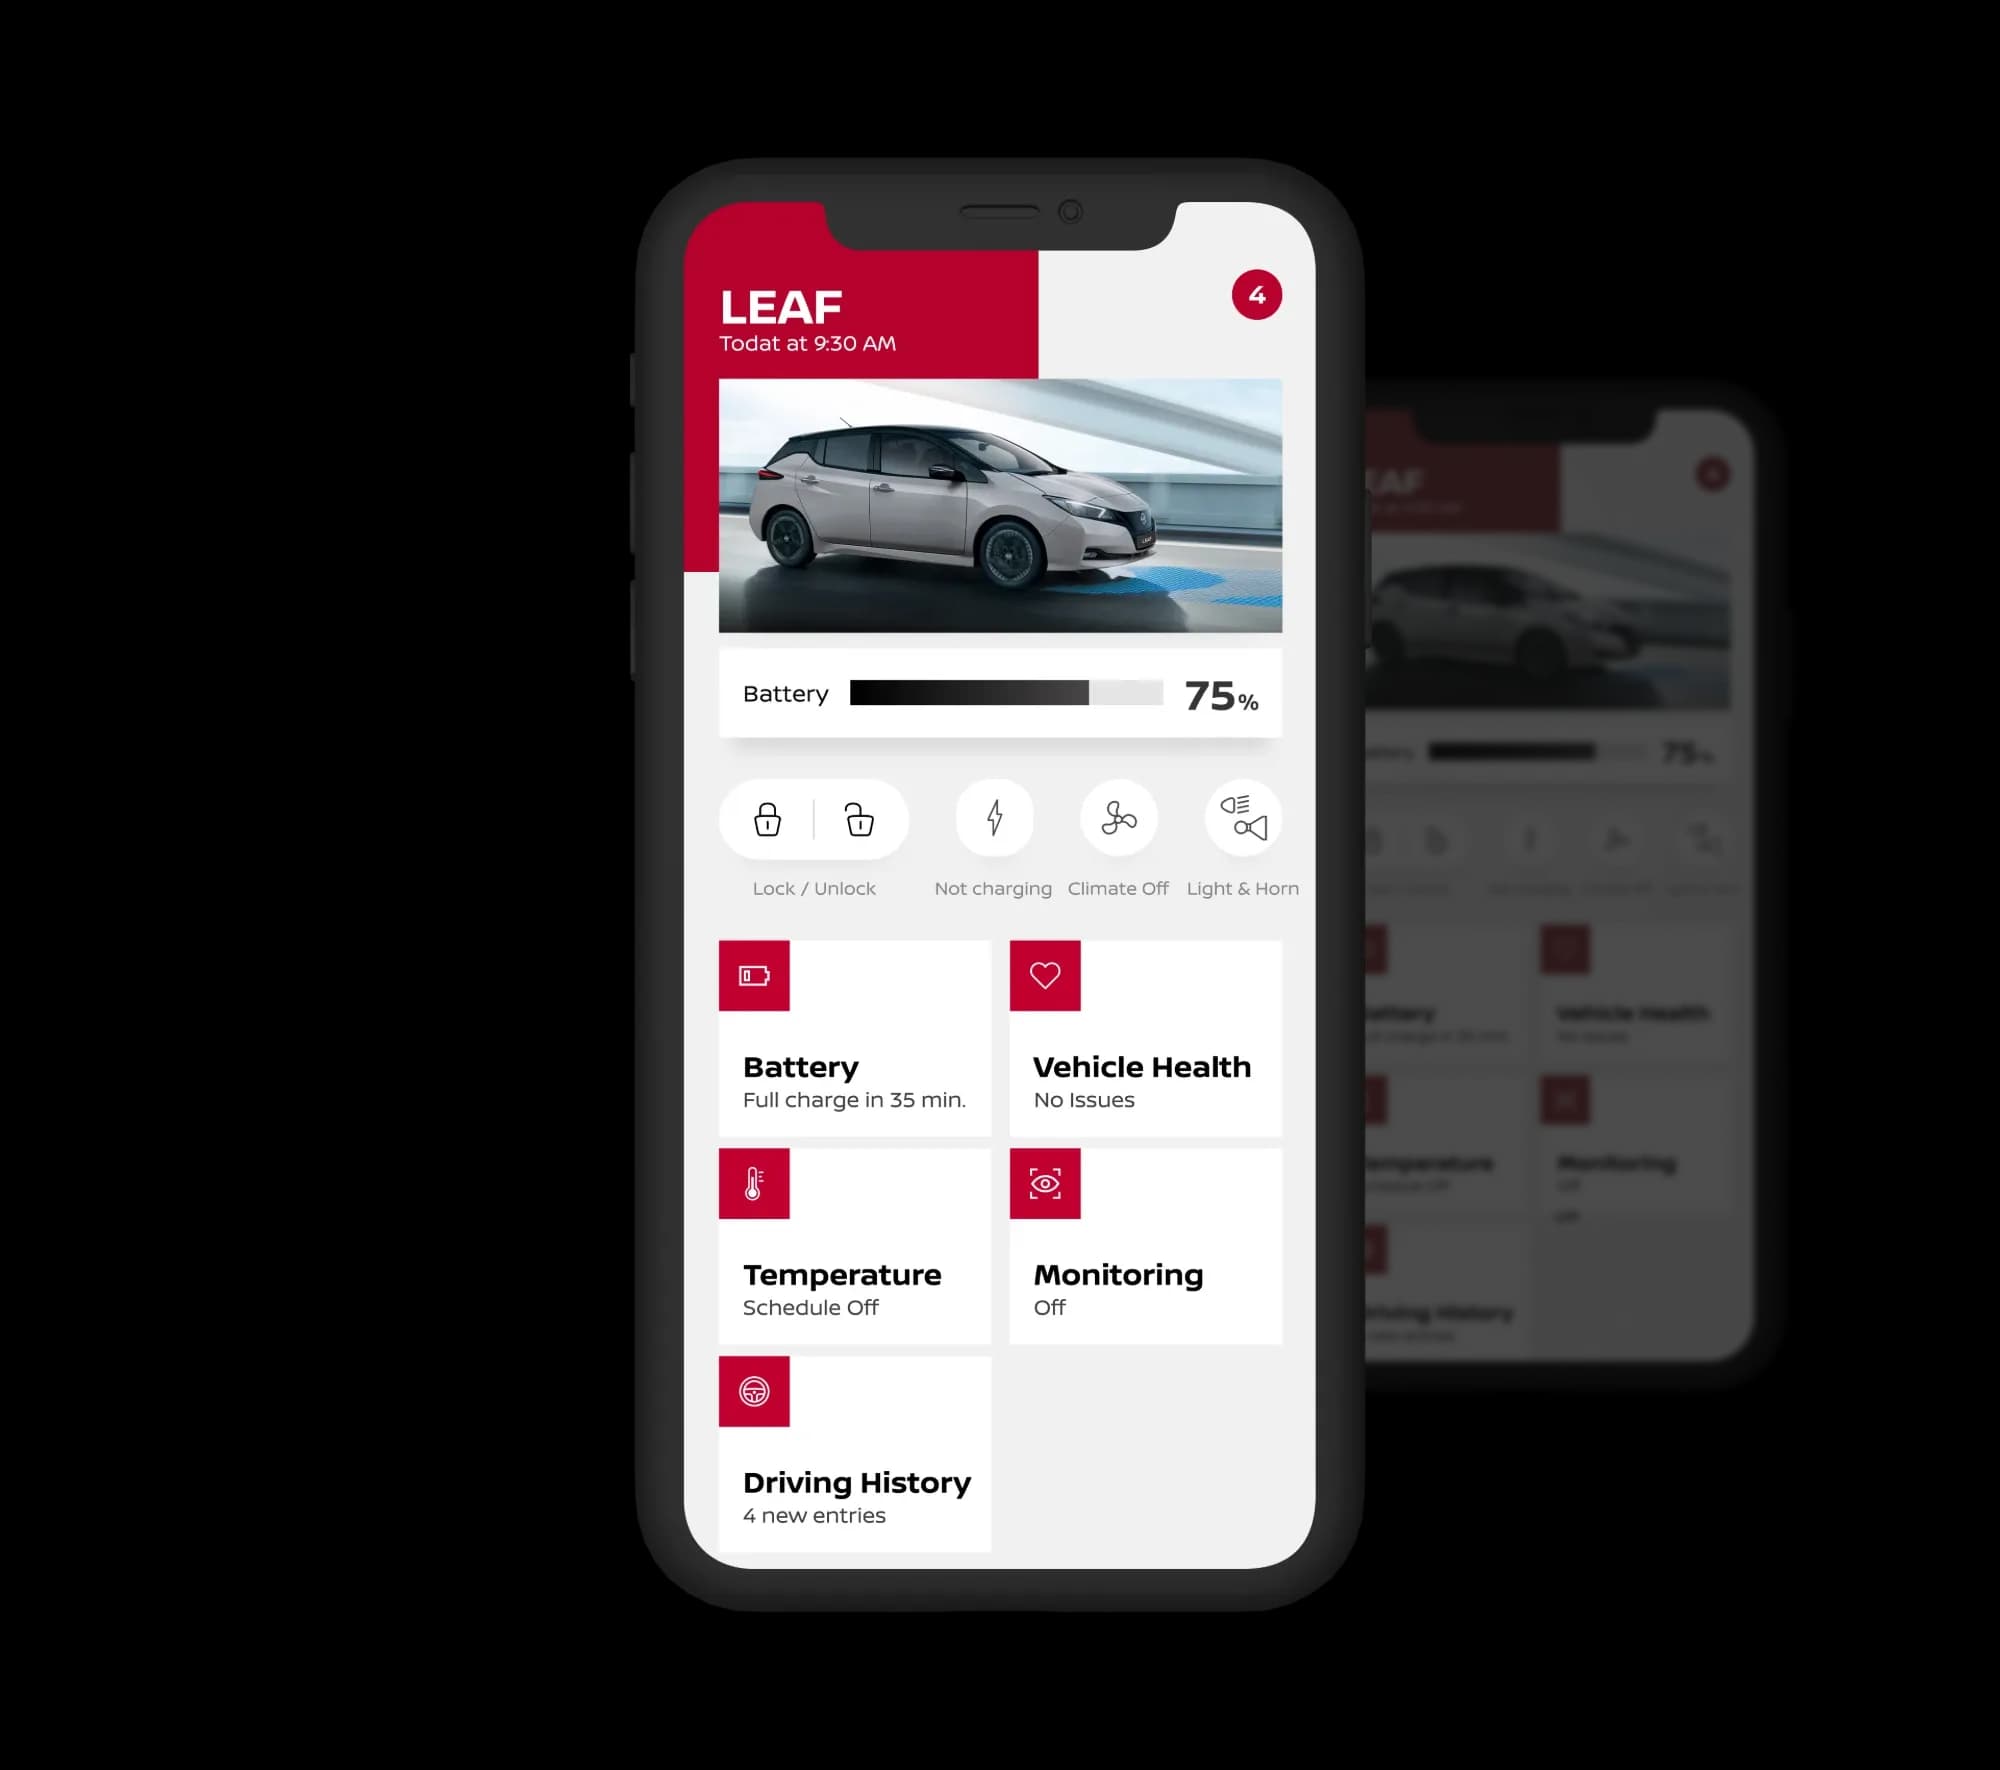
Nissan Box serves drivers of both thermal and electric Nissan vehicles. A single application had to adapt to very different models and needs, from checking a car's status to controlling it remotely.
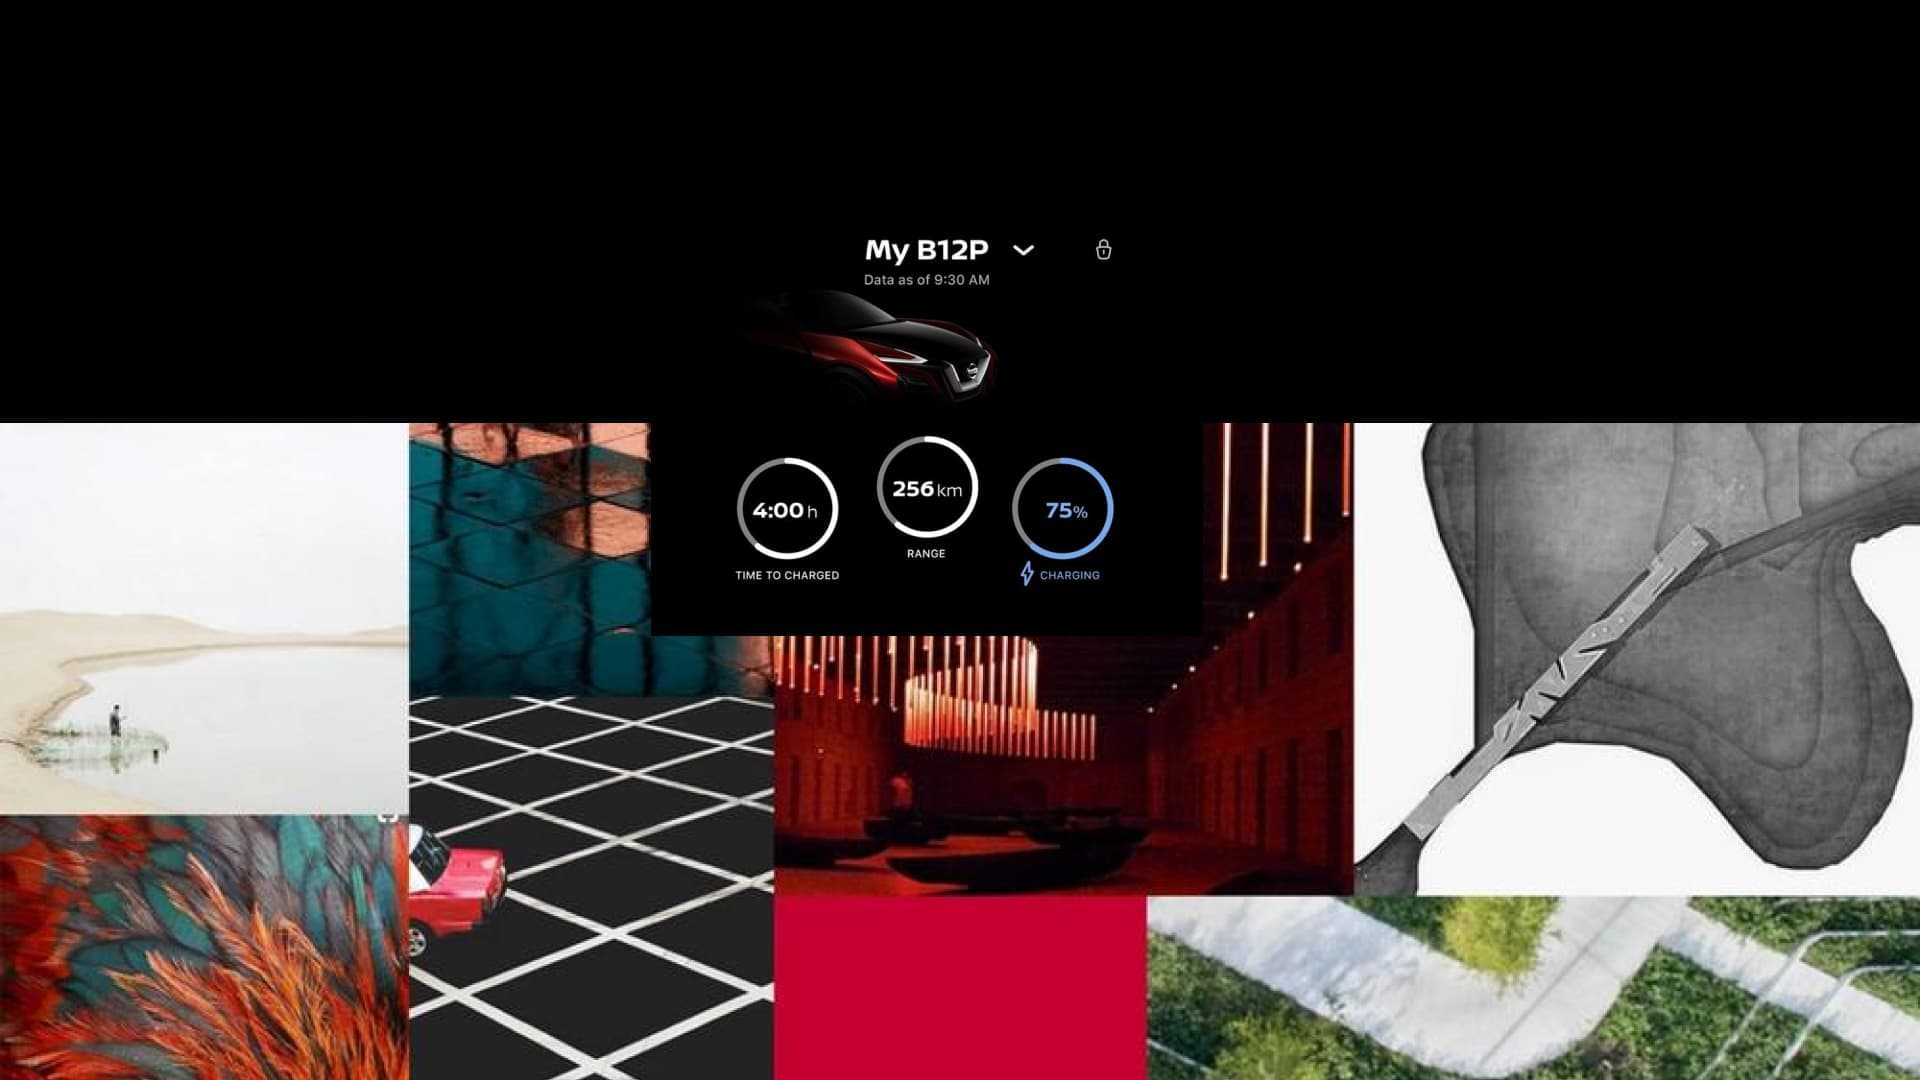
Art direction: an electric-vehicle status screen (charging time, range, battery) and its mood board.
02
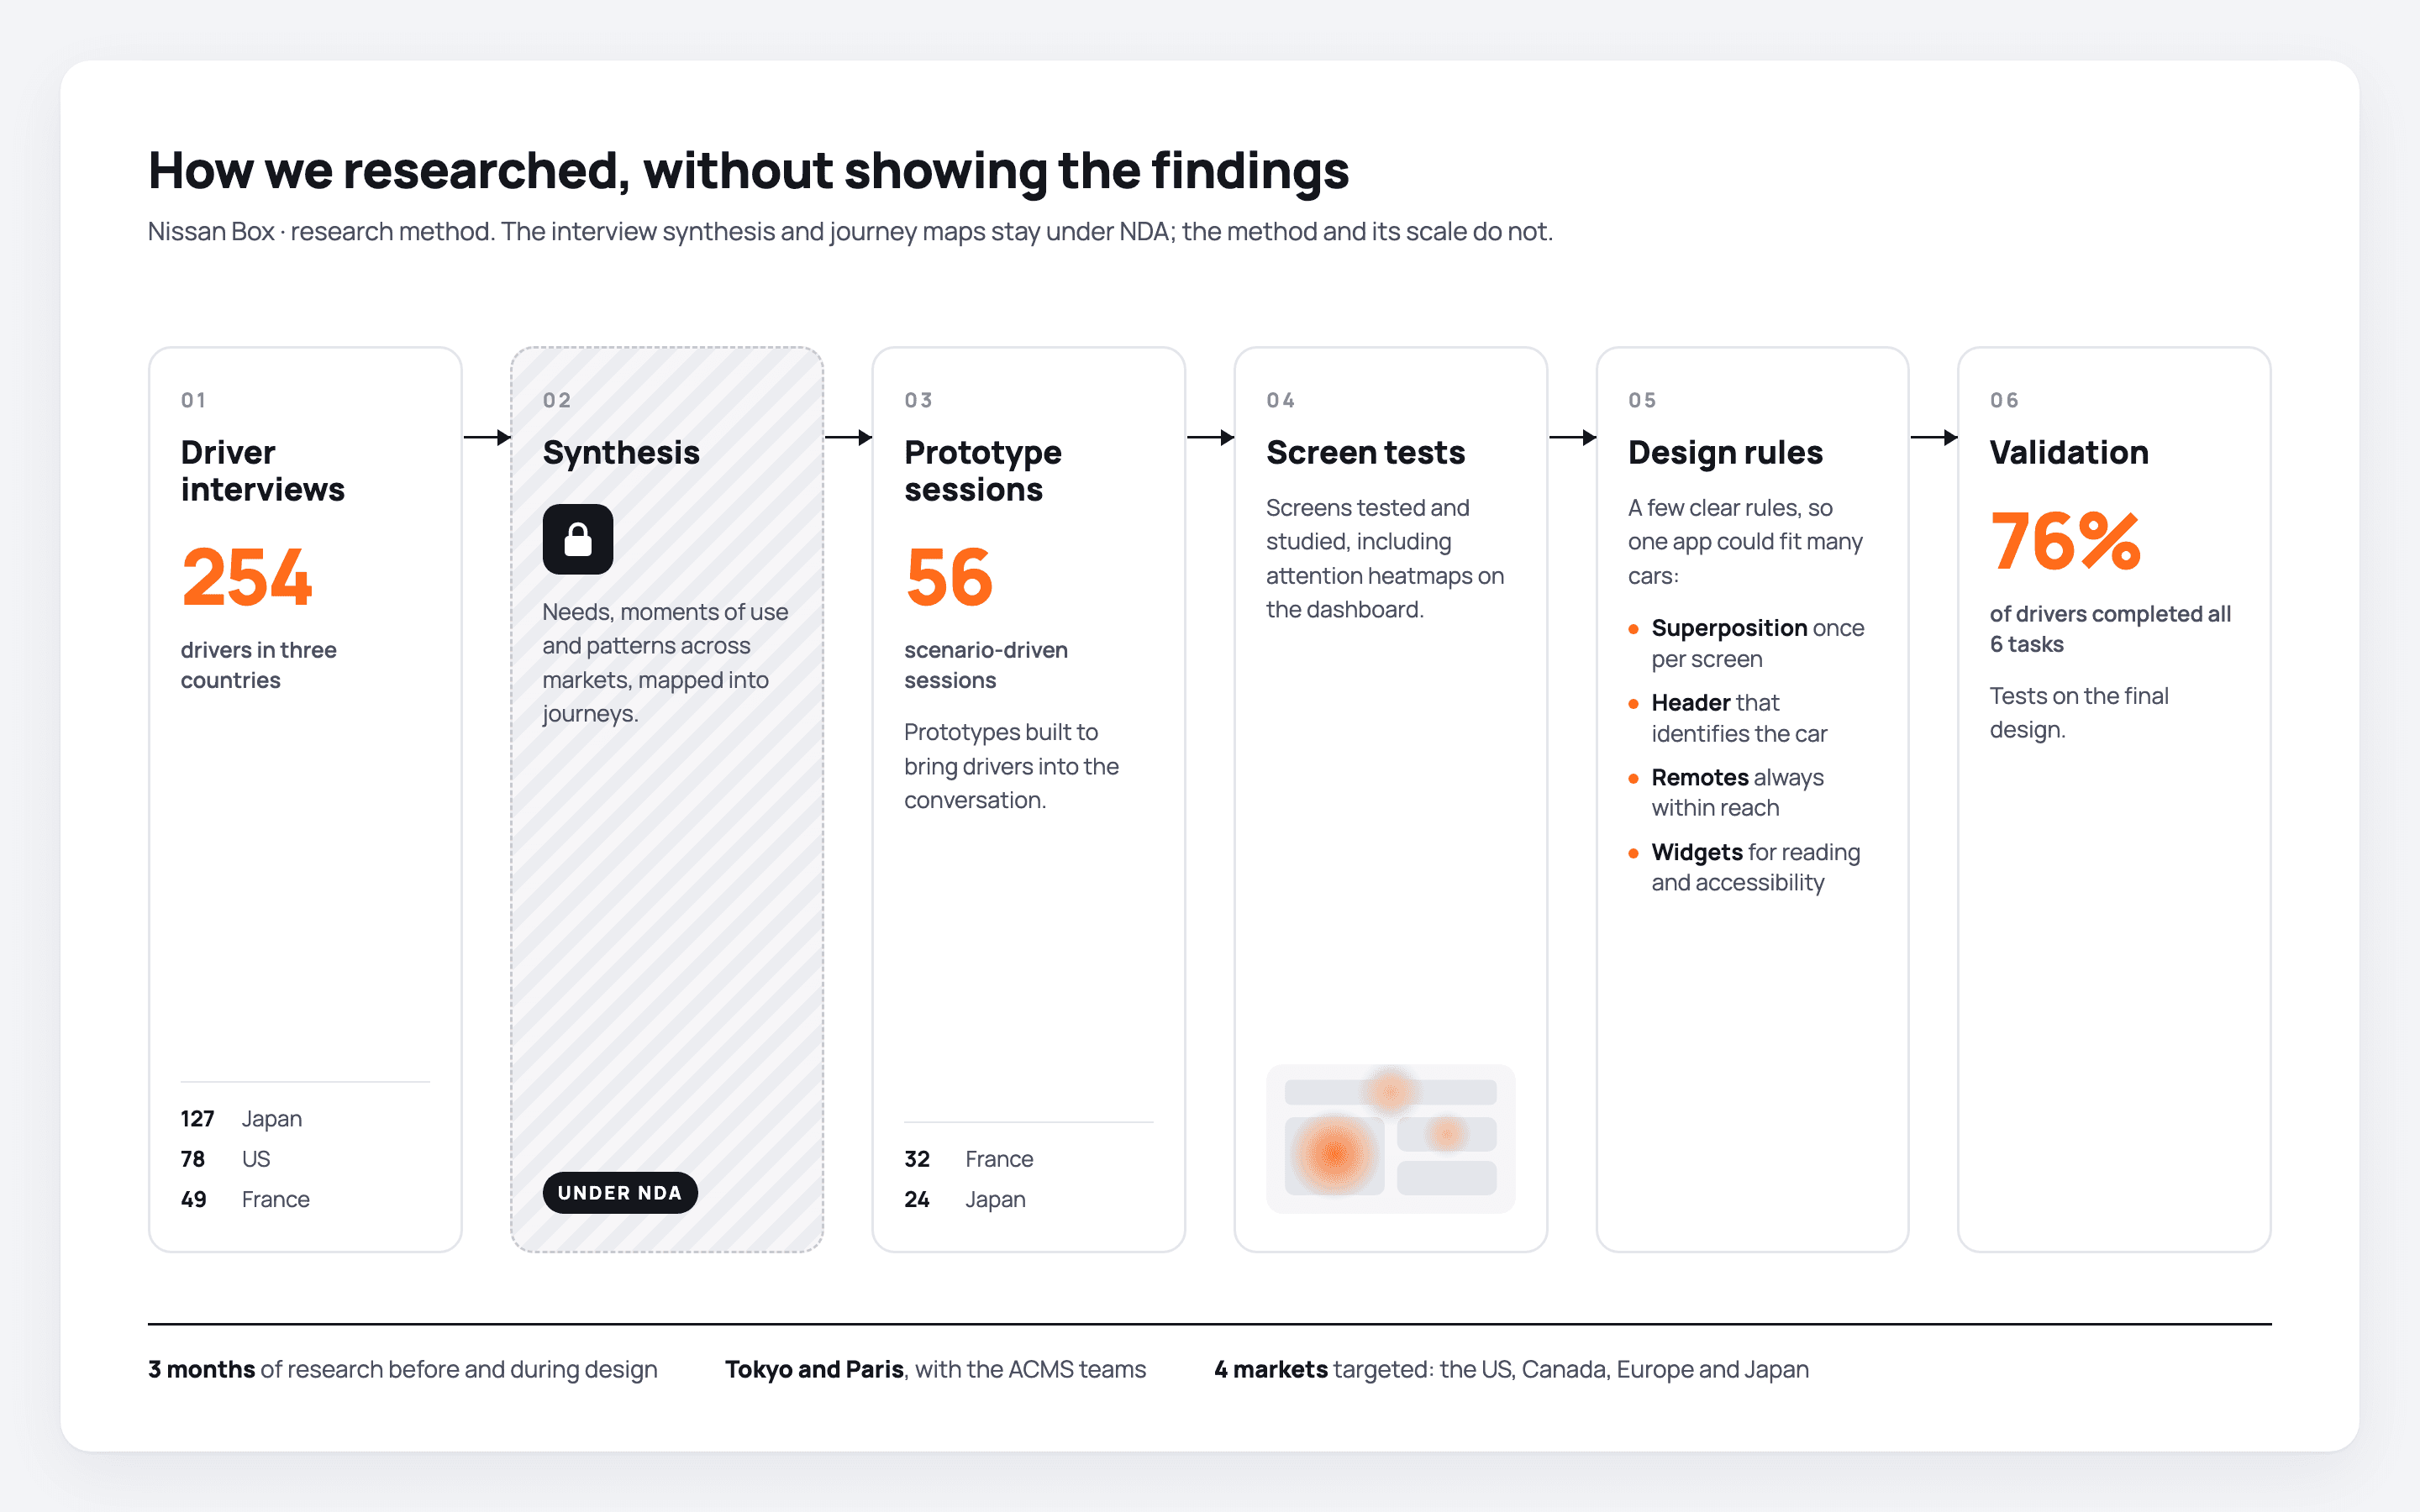
Three months with drivers before designing.
3 mo.Research and analysis
Three months of research and analysis.
254User interviews
Interviews with drivers.
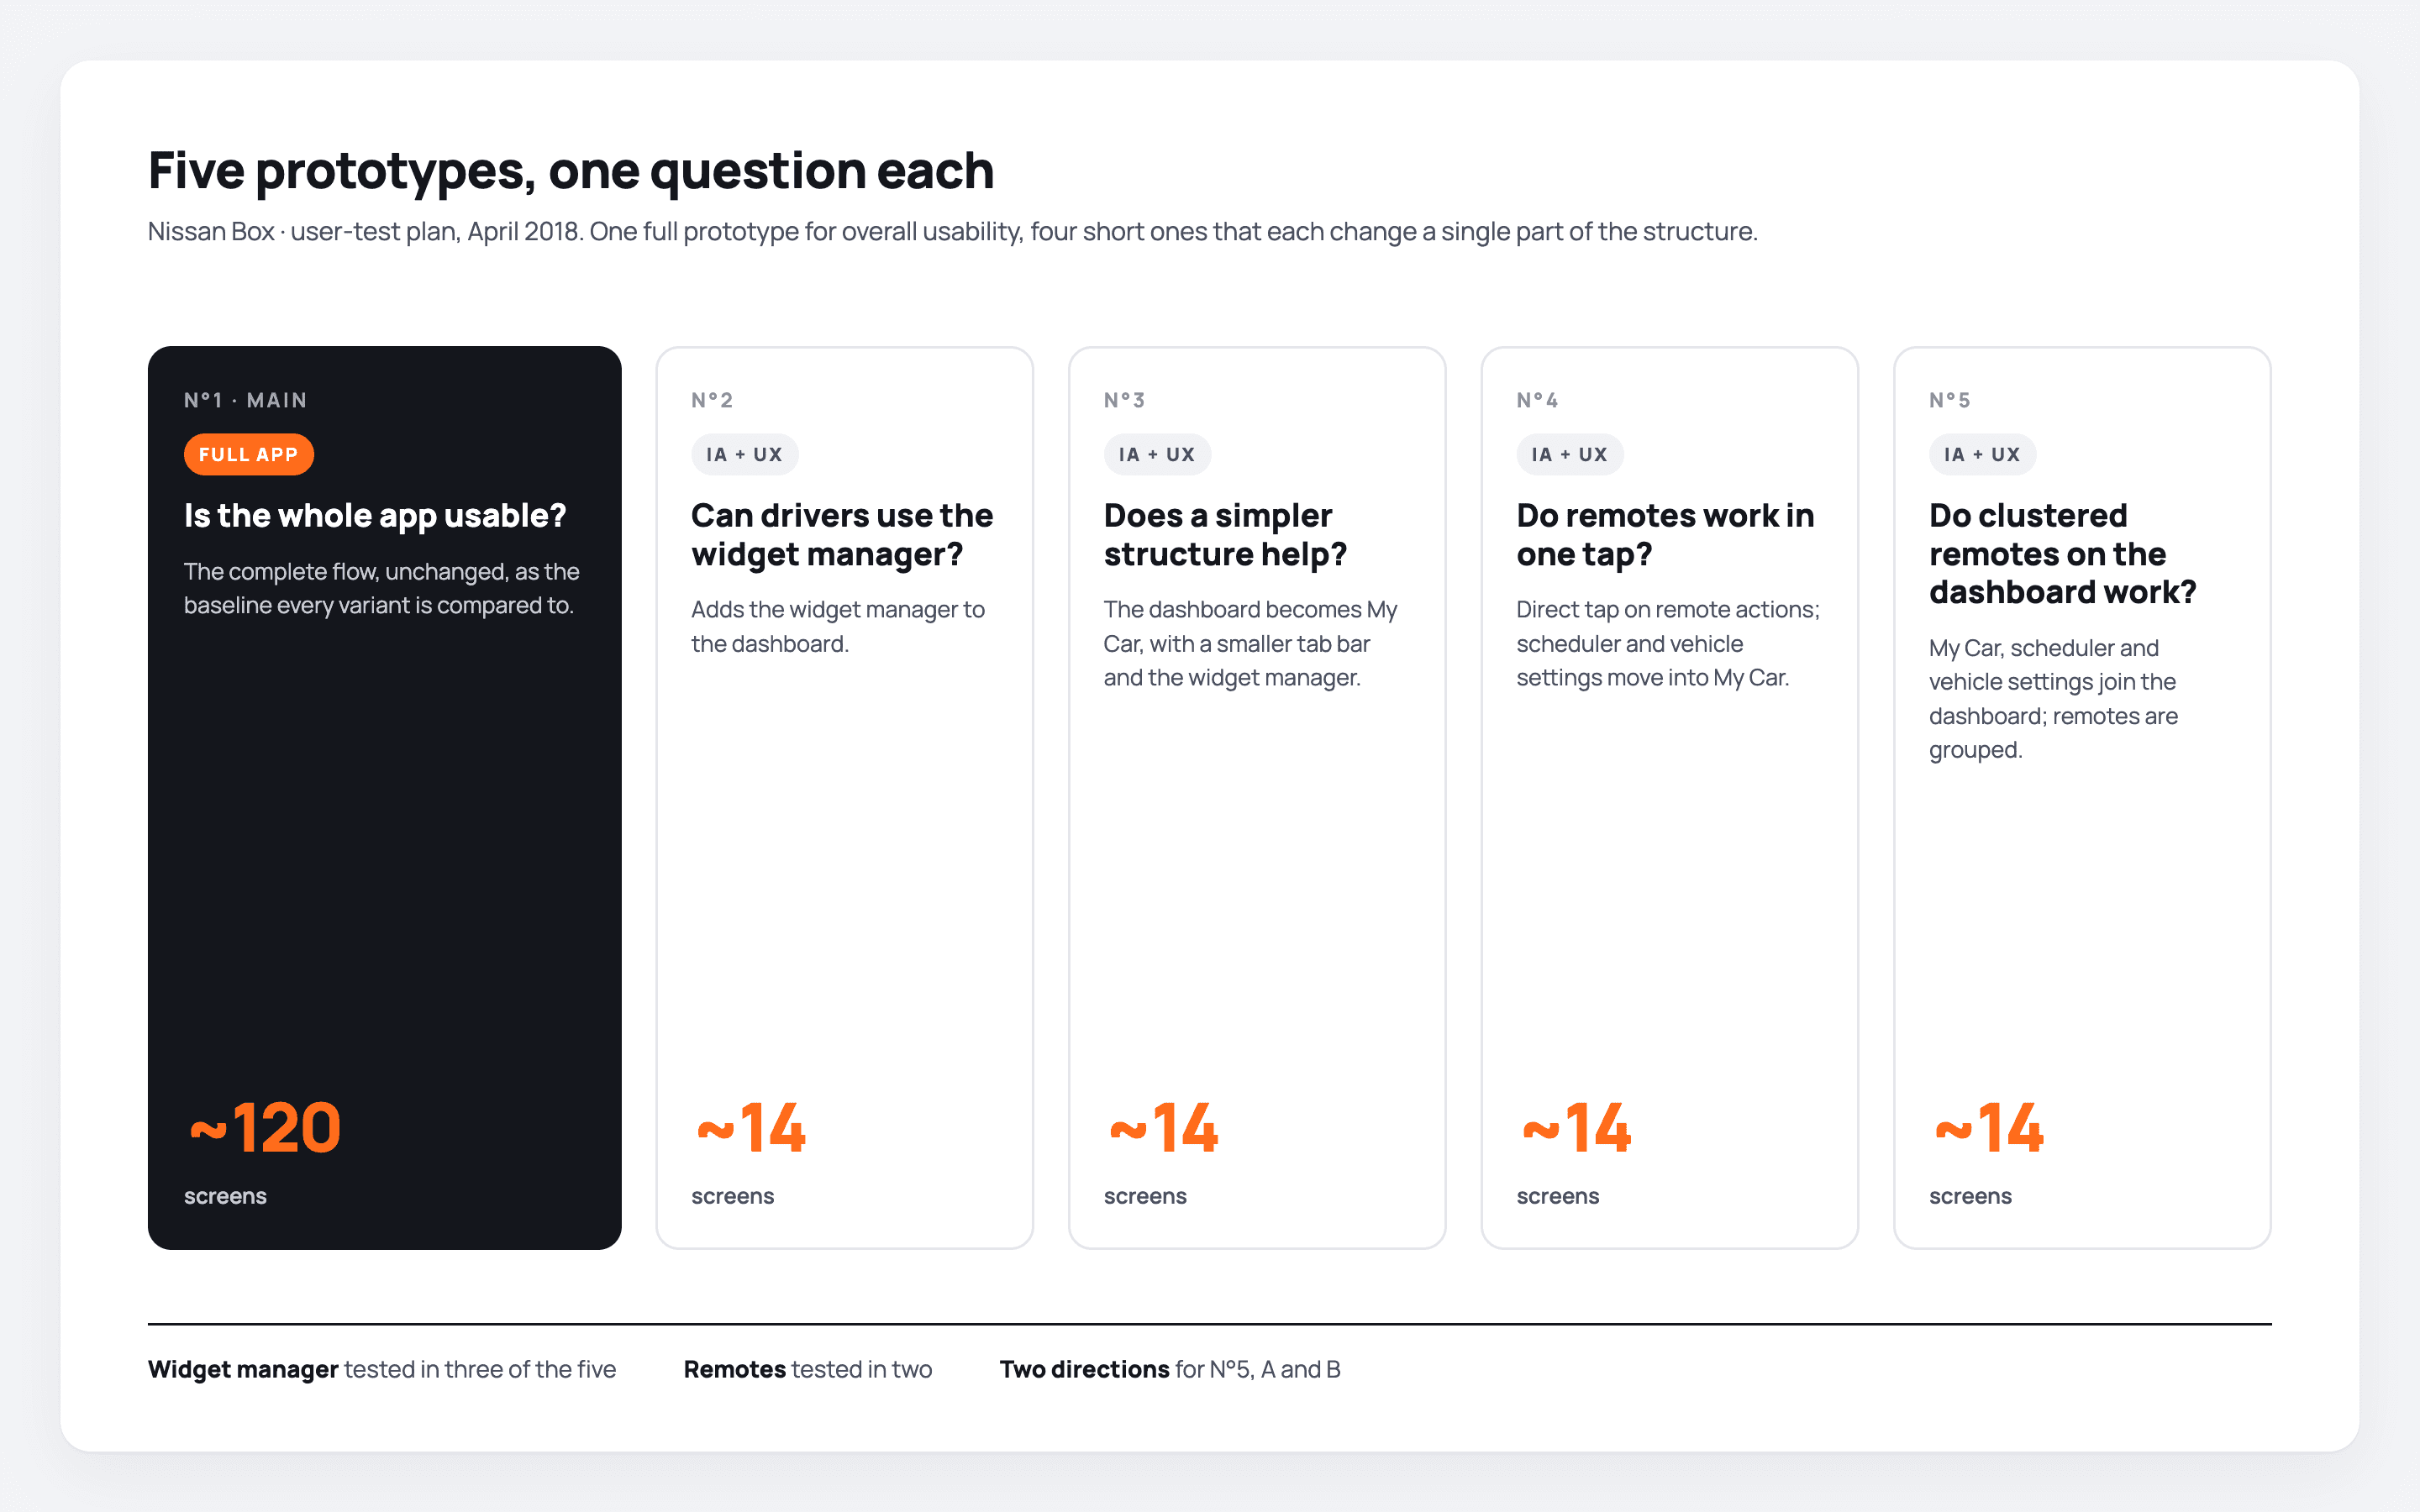
5Prototypes
Prototypes built to engage users in the conversation.
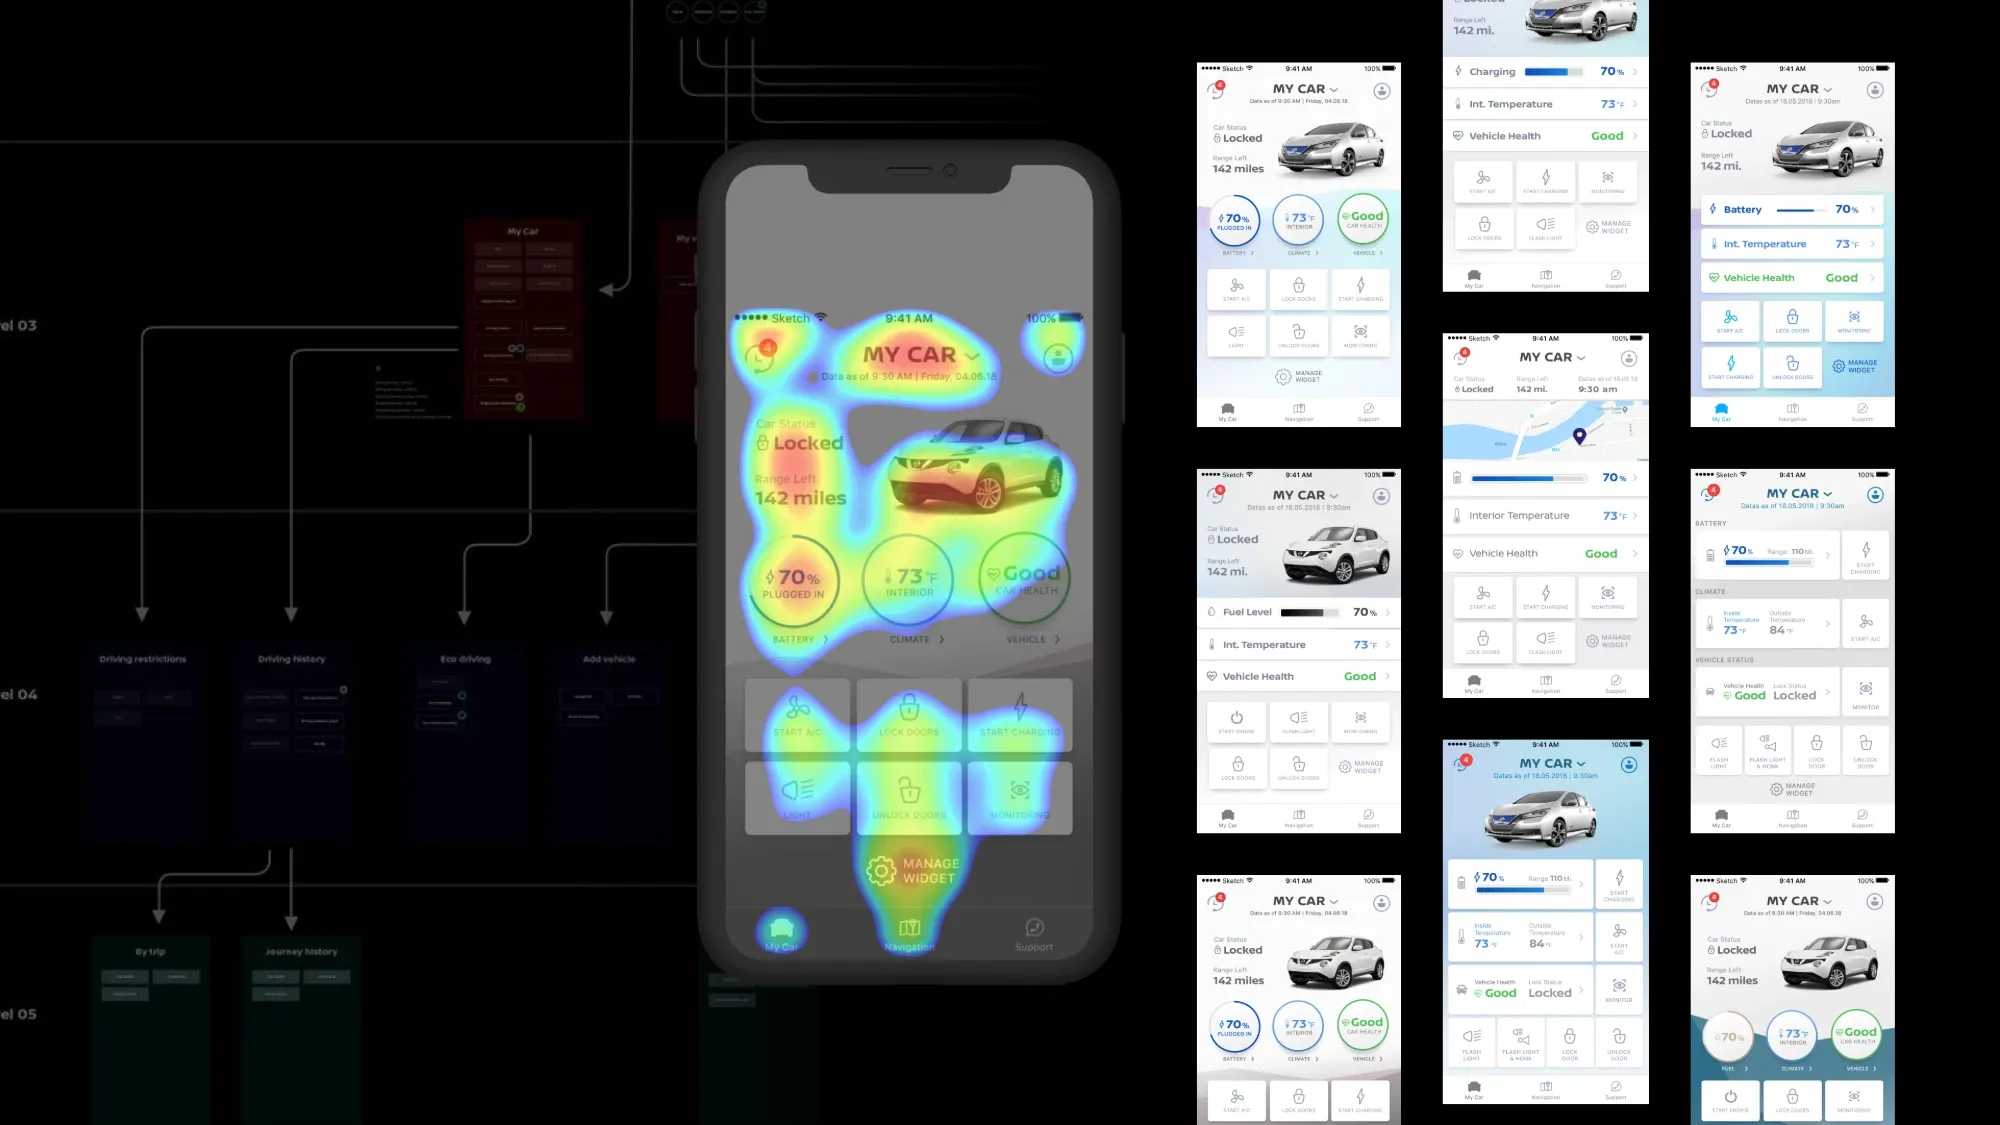
56Screen tests
Testing and studying screens, including attention heatmaps on the dashboard.
254Drivers interviewed
78 in the US, 127 in Japan and 49 in France.
56Test sessions
32 in France and 24 in Japan, with prototypes and scenario-driven interviews.
4Markets targeted
The US, Canada, Europe and Japan.
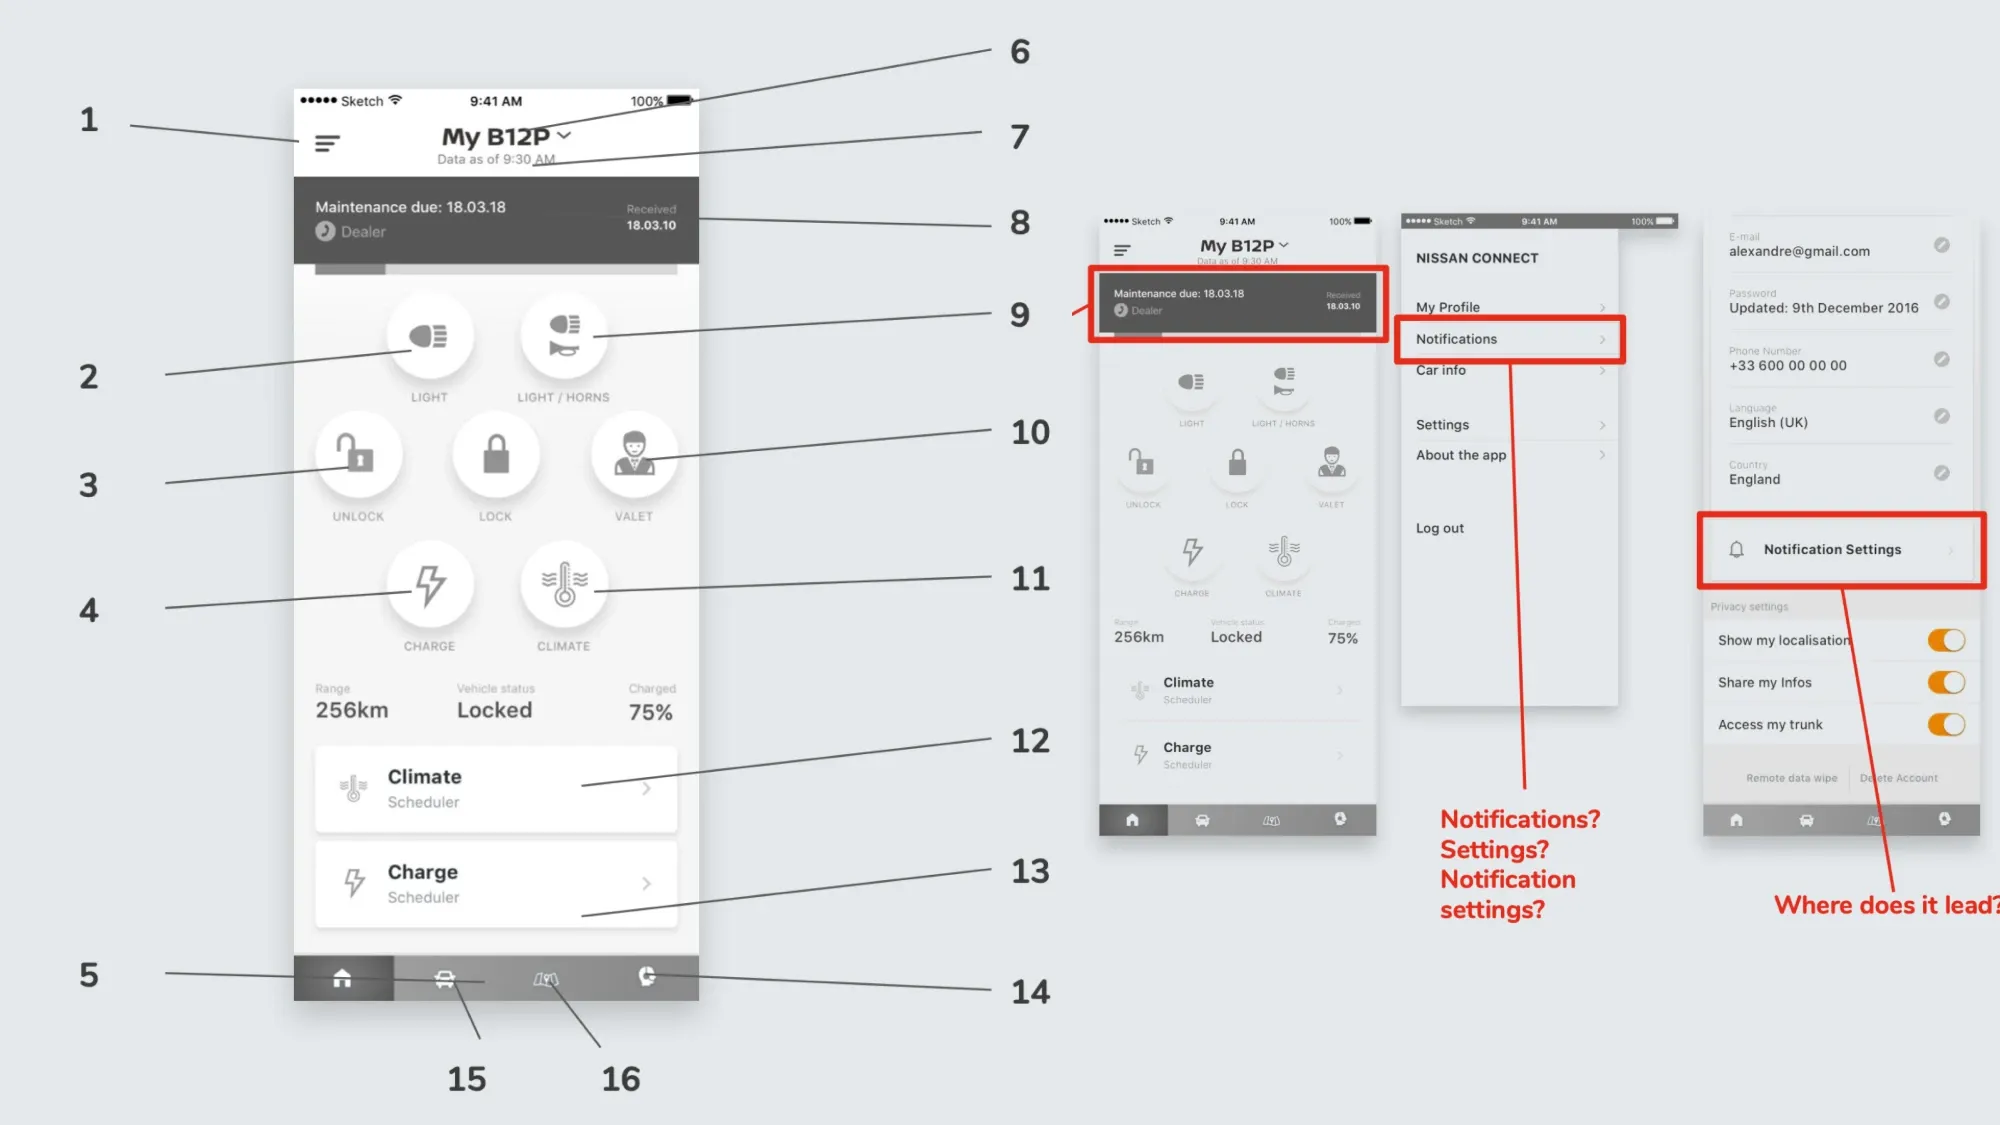
03
Three findings that moved the app away from a remote control.
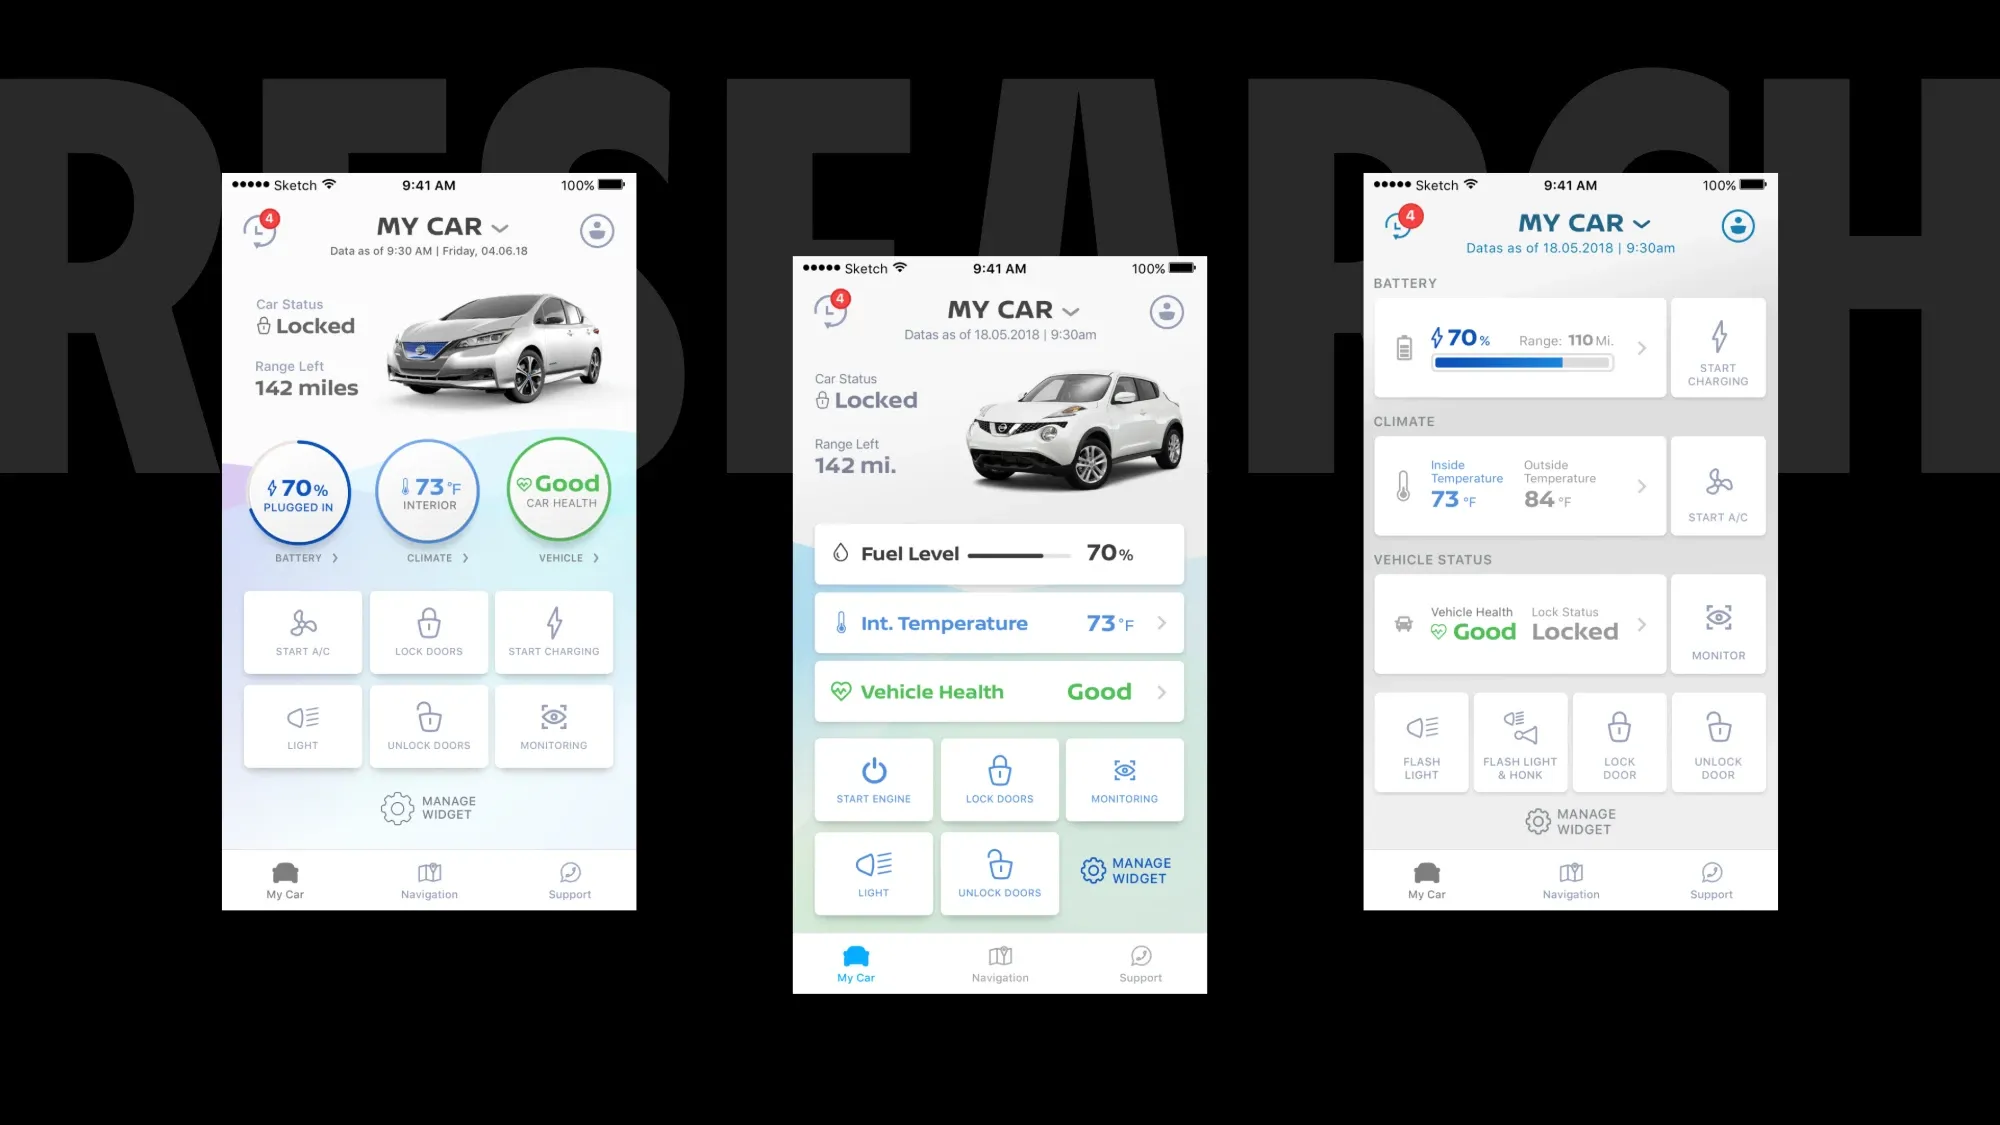
The brands wanted the new remote functions at the forefront: open the car, start it, prepare a playlist.
Instant actions were secondary, or even less than that. What mattered more to drivers was calculating their consumption and managing the vehicle over the long term.
Fuel consumption and vehicle health got their own screens, with a workflow to reach the detail of every point, while the remotes stayed within reach.
Safety when parked in public areas was a priority, especially if it could be monitored from the app. Drivers wanted both the inside and the outside context of the car while it was parked.
Inside: the lock status of every door, the power status, the GPS location and the latest lock and unlock actions. Outside: the images of the parking cameras, on the models that have them.
The cameras brought visual information into the app and reassured drivers.
Drivers were sceptical at first about an app handling vehicle health and fuel level.
Once they could rely on the precision of the data, these became the two central features of their usage. They needed to be reassured.
Timestamps that anchor each figure in reality. A fuel report every time the driver enters the car or opens consumption. A reload option on every health status, to know when it was last checked. A button to ask partners, garages and mechanics for feedback on a health feature.
The information no longer stays isolated in a phone: experts can look at it.
04
What to put first, and getting three regions to agree.
North America, Europe and Japan wanted the remote functions at the forefront, because they introduced new technology to activate the car remotely. Research said drivers' priorities were elsewhere.
Kept always accessible, with a clear tap affordance, but no longer the main subject of the app.
Each with a workflow to reach the detail of every point. Consumption: when fuel was used most, the speed at the time, the location. Health: oil, brakes, wheel pressure, battery level and health, and where a potential issue may come from.
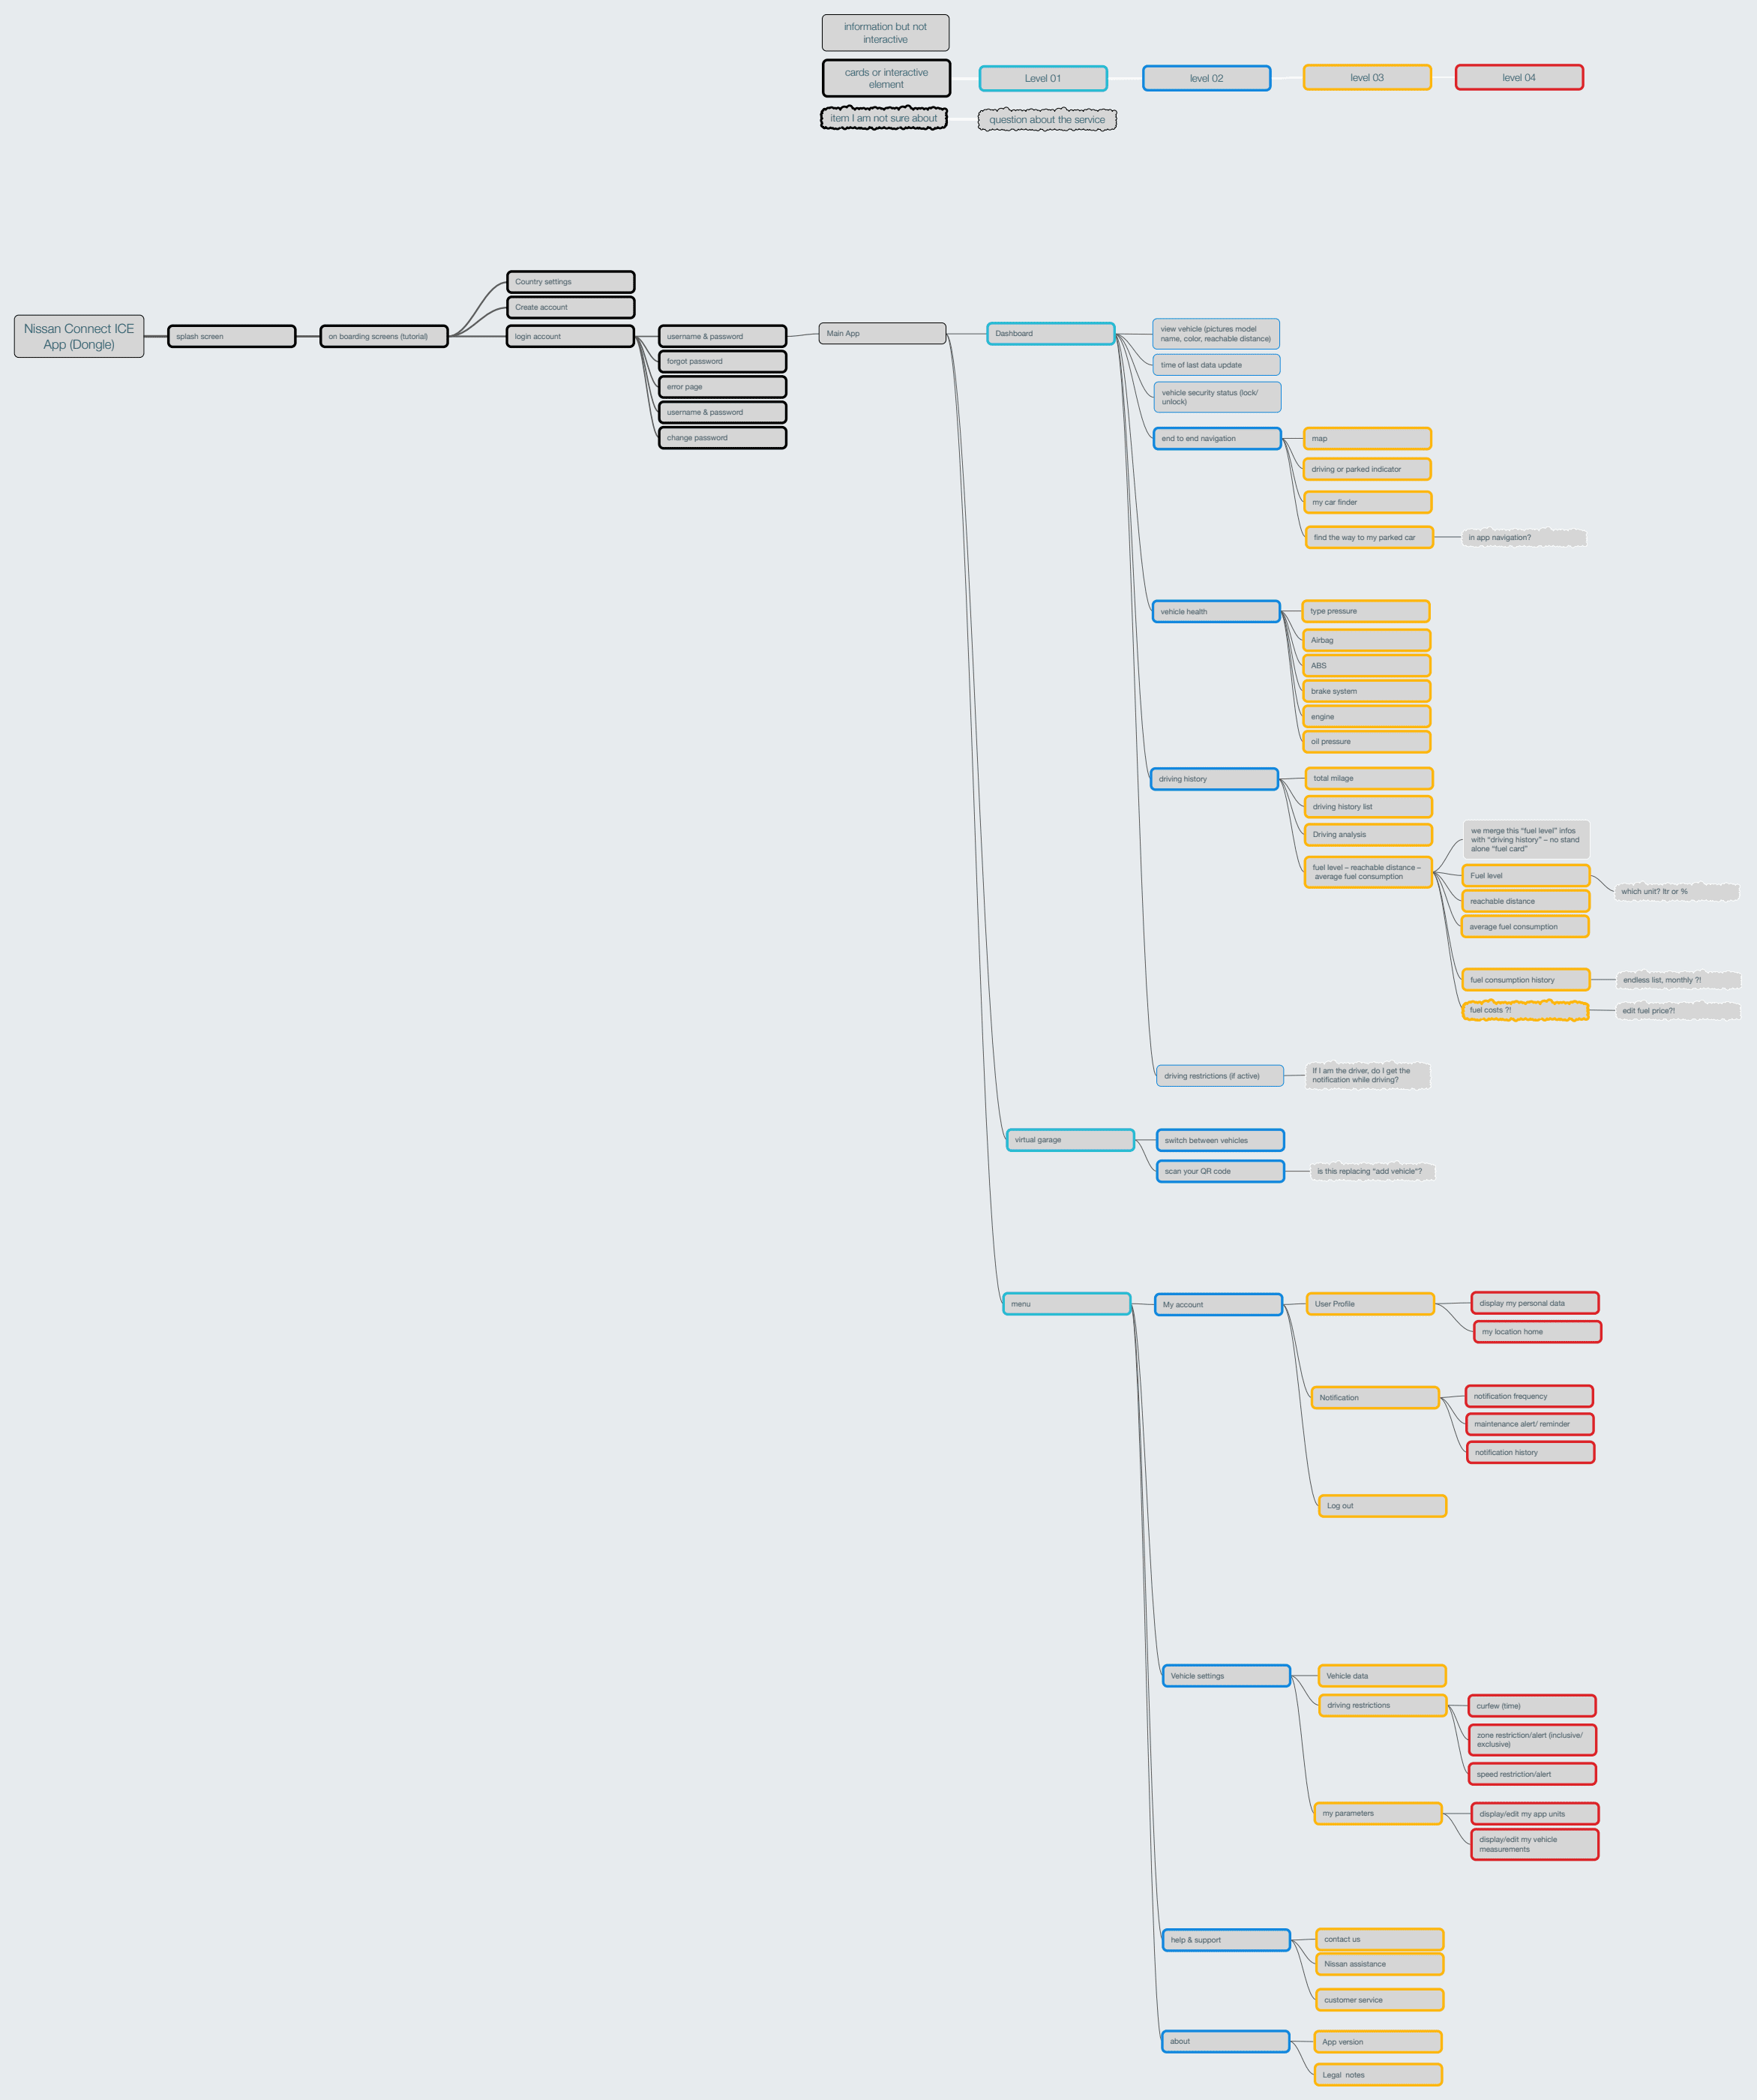
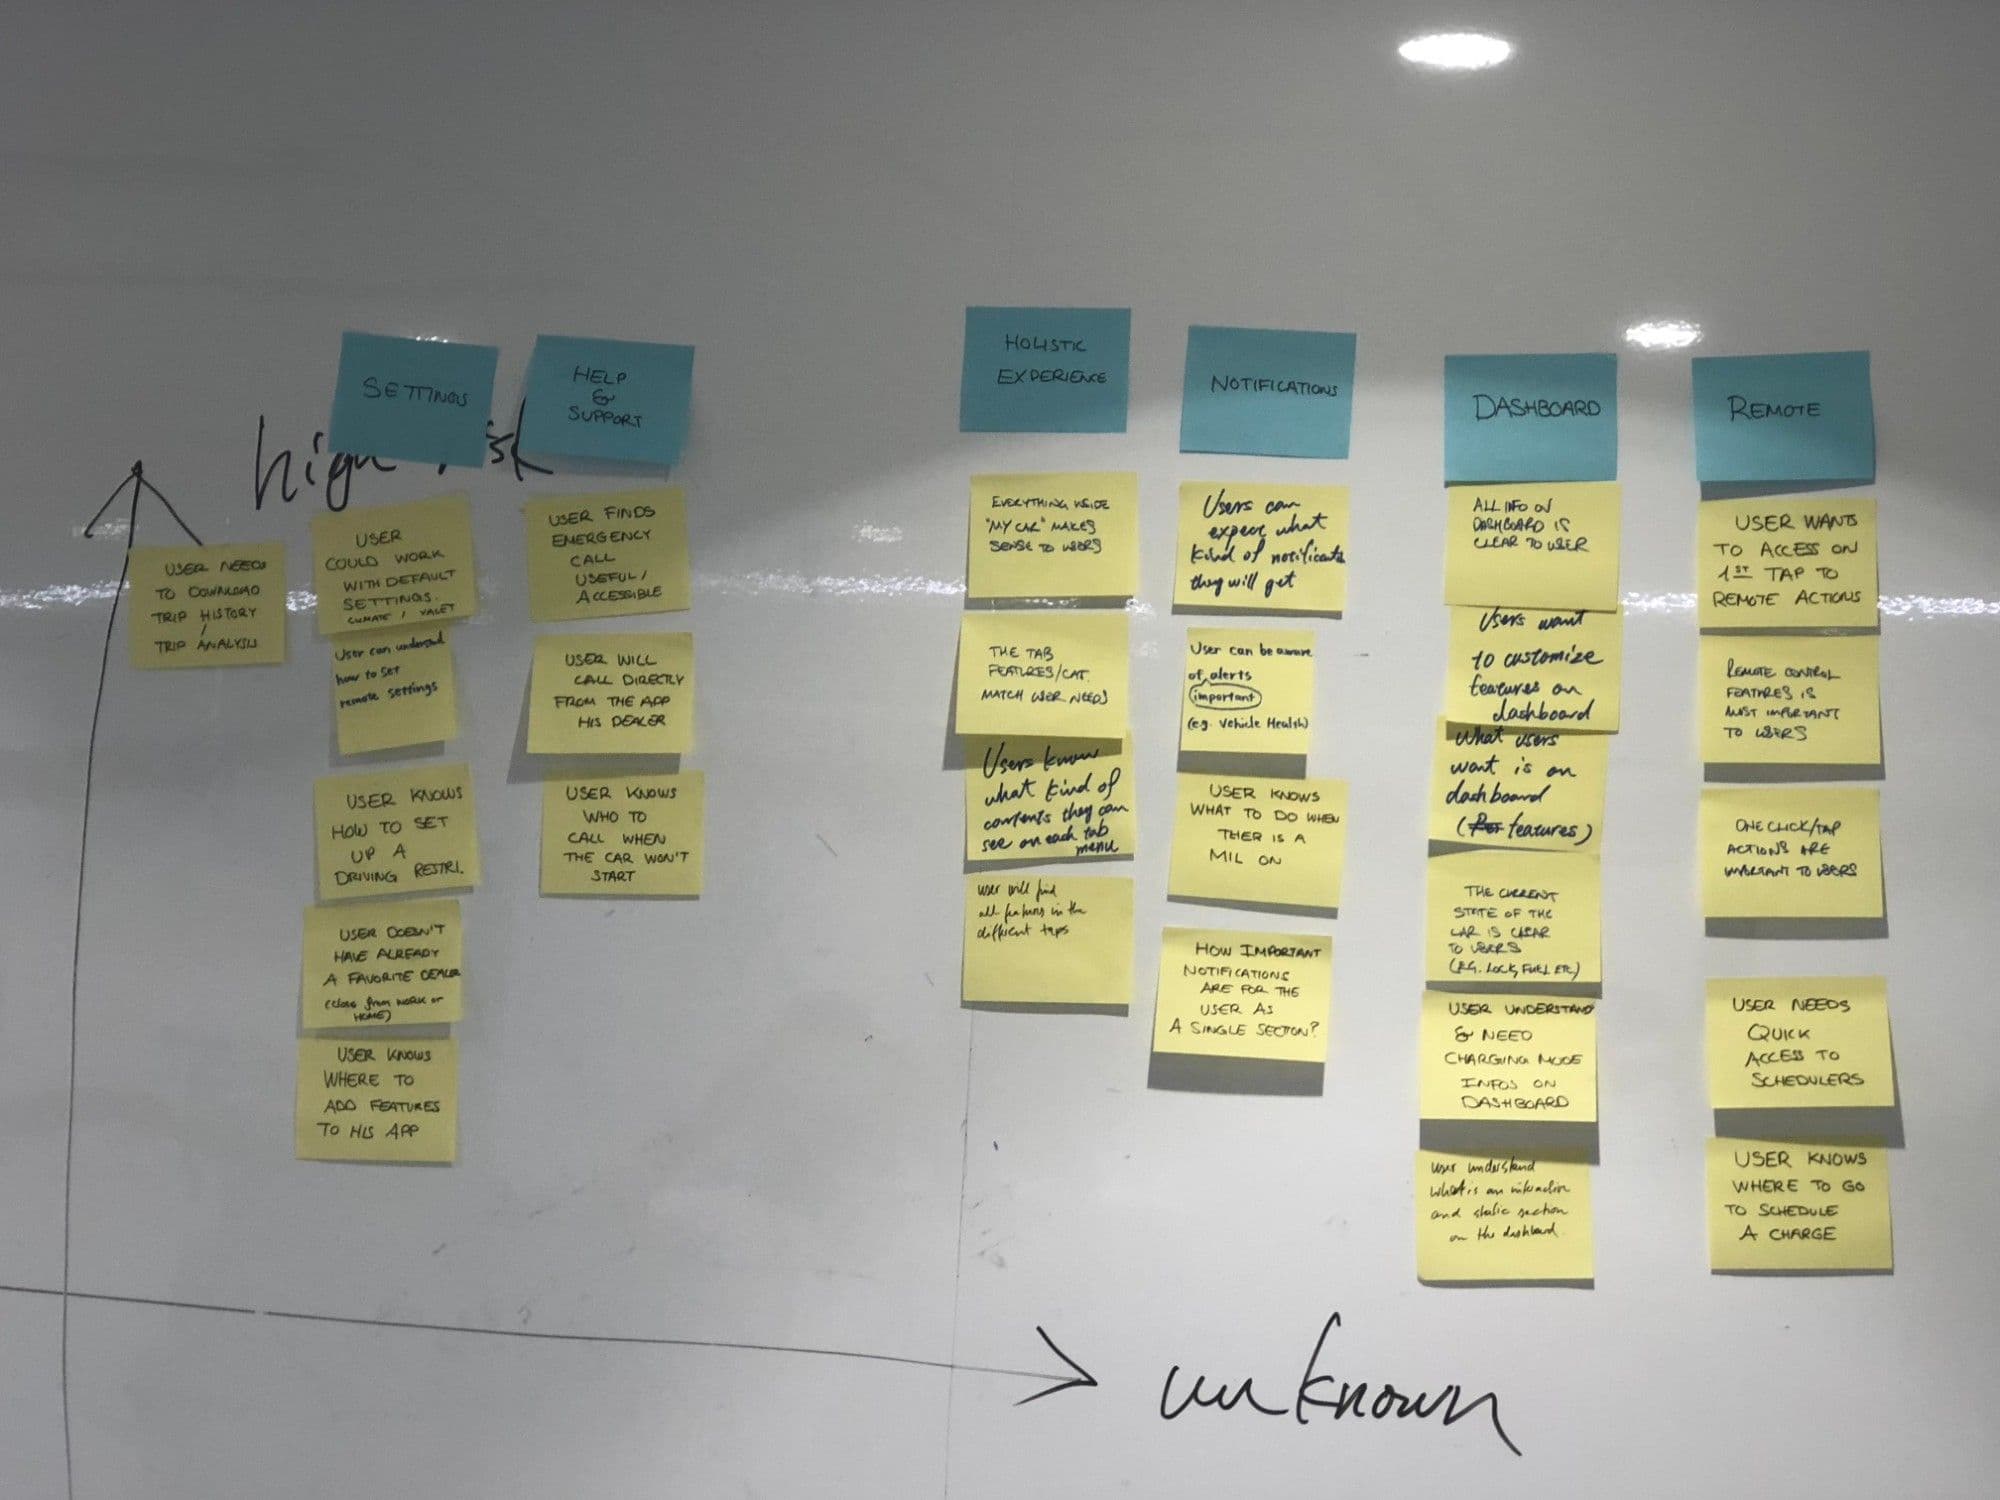
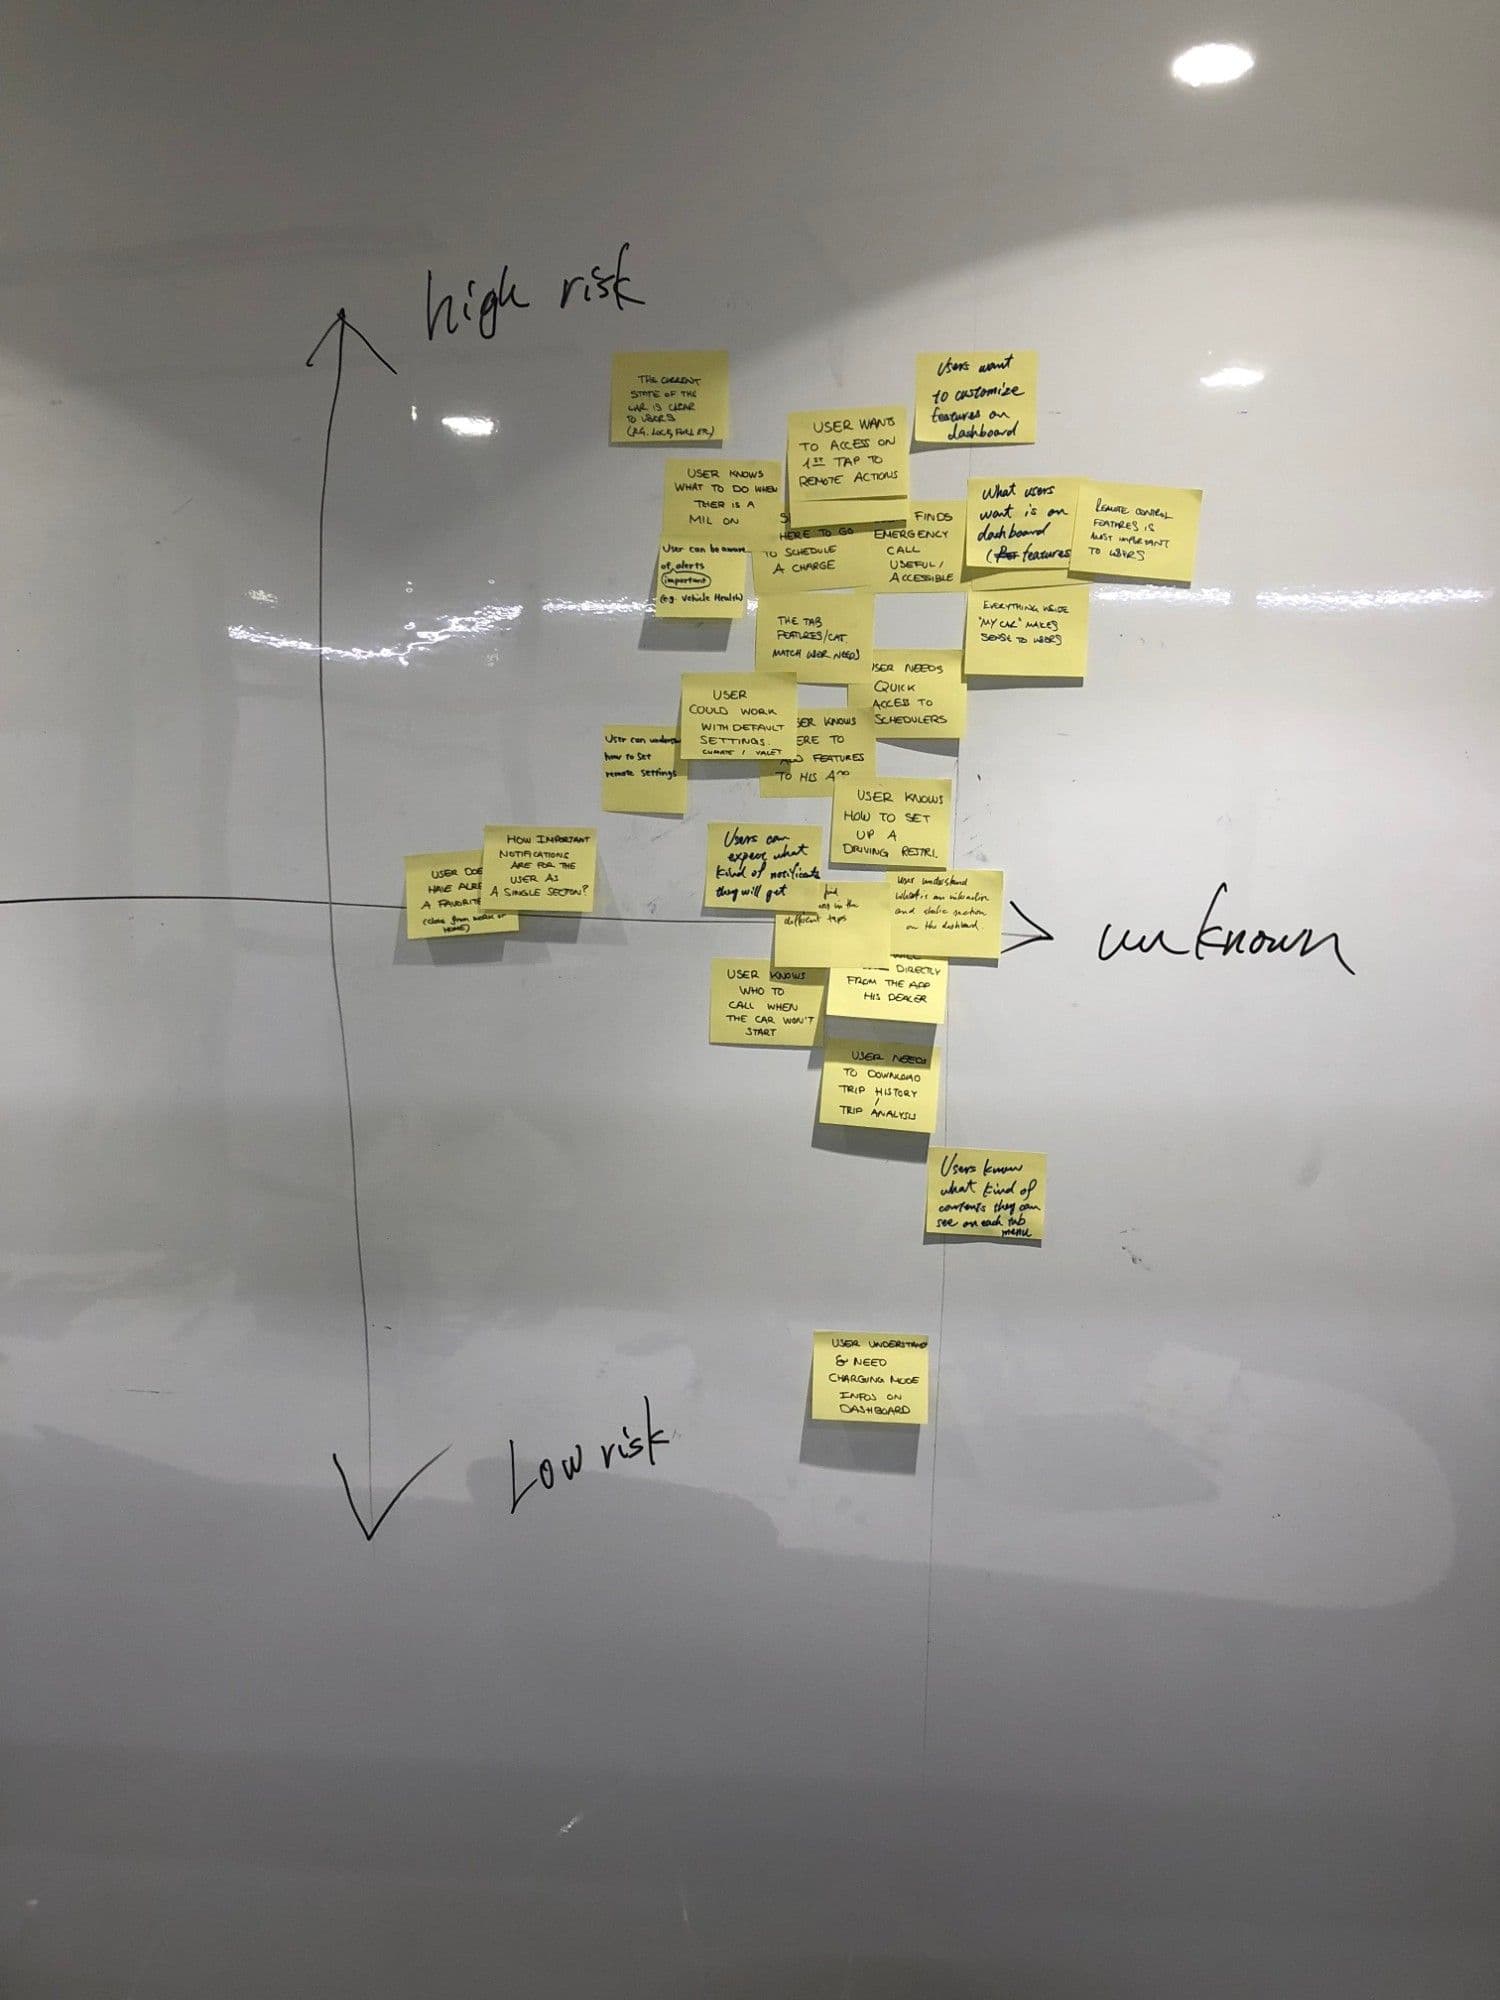
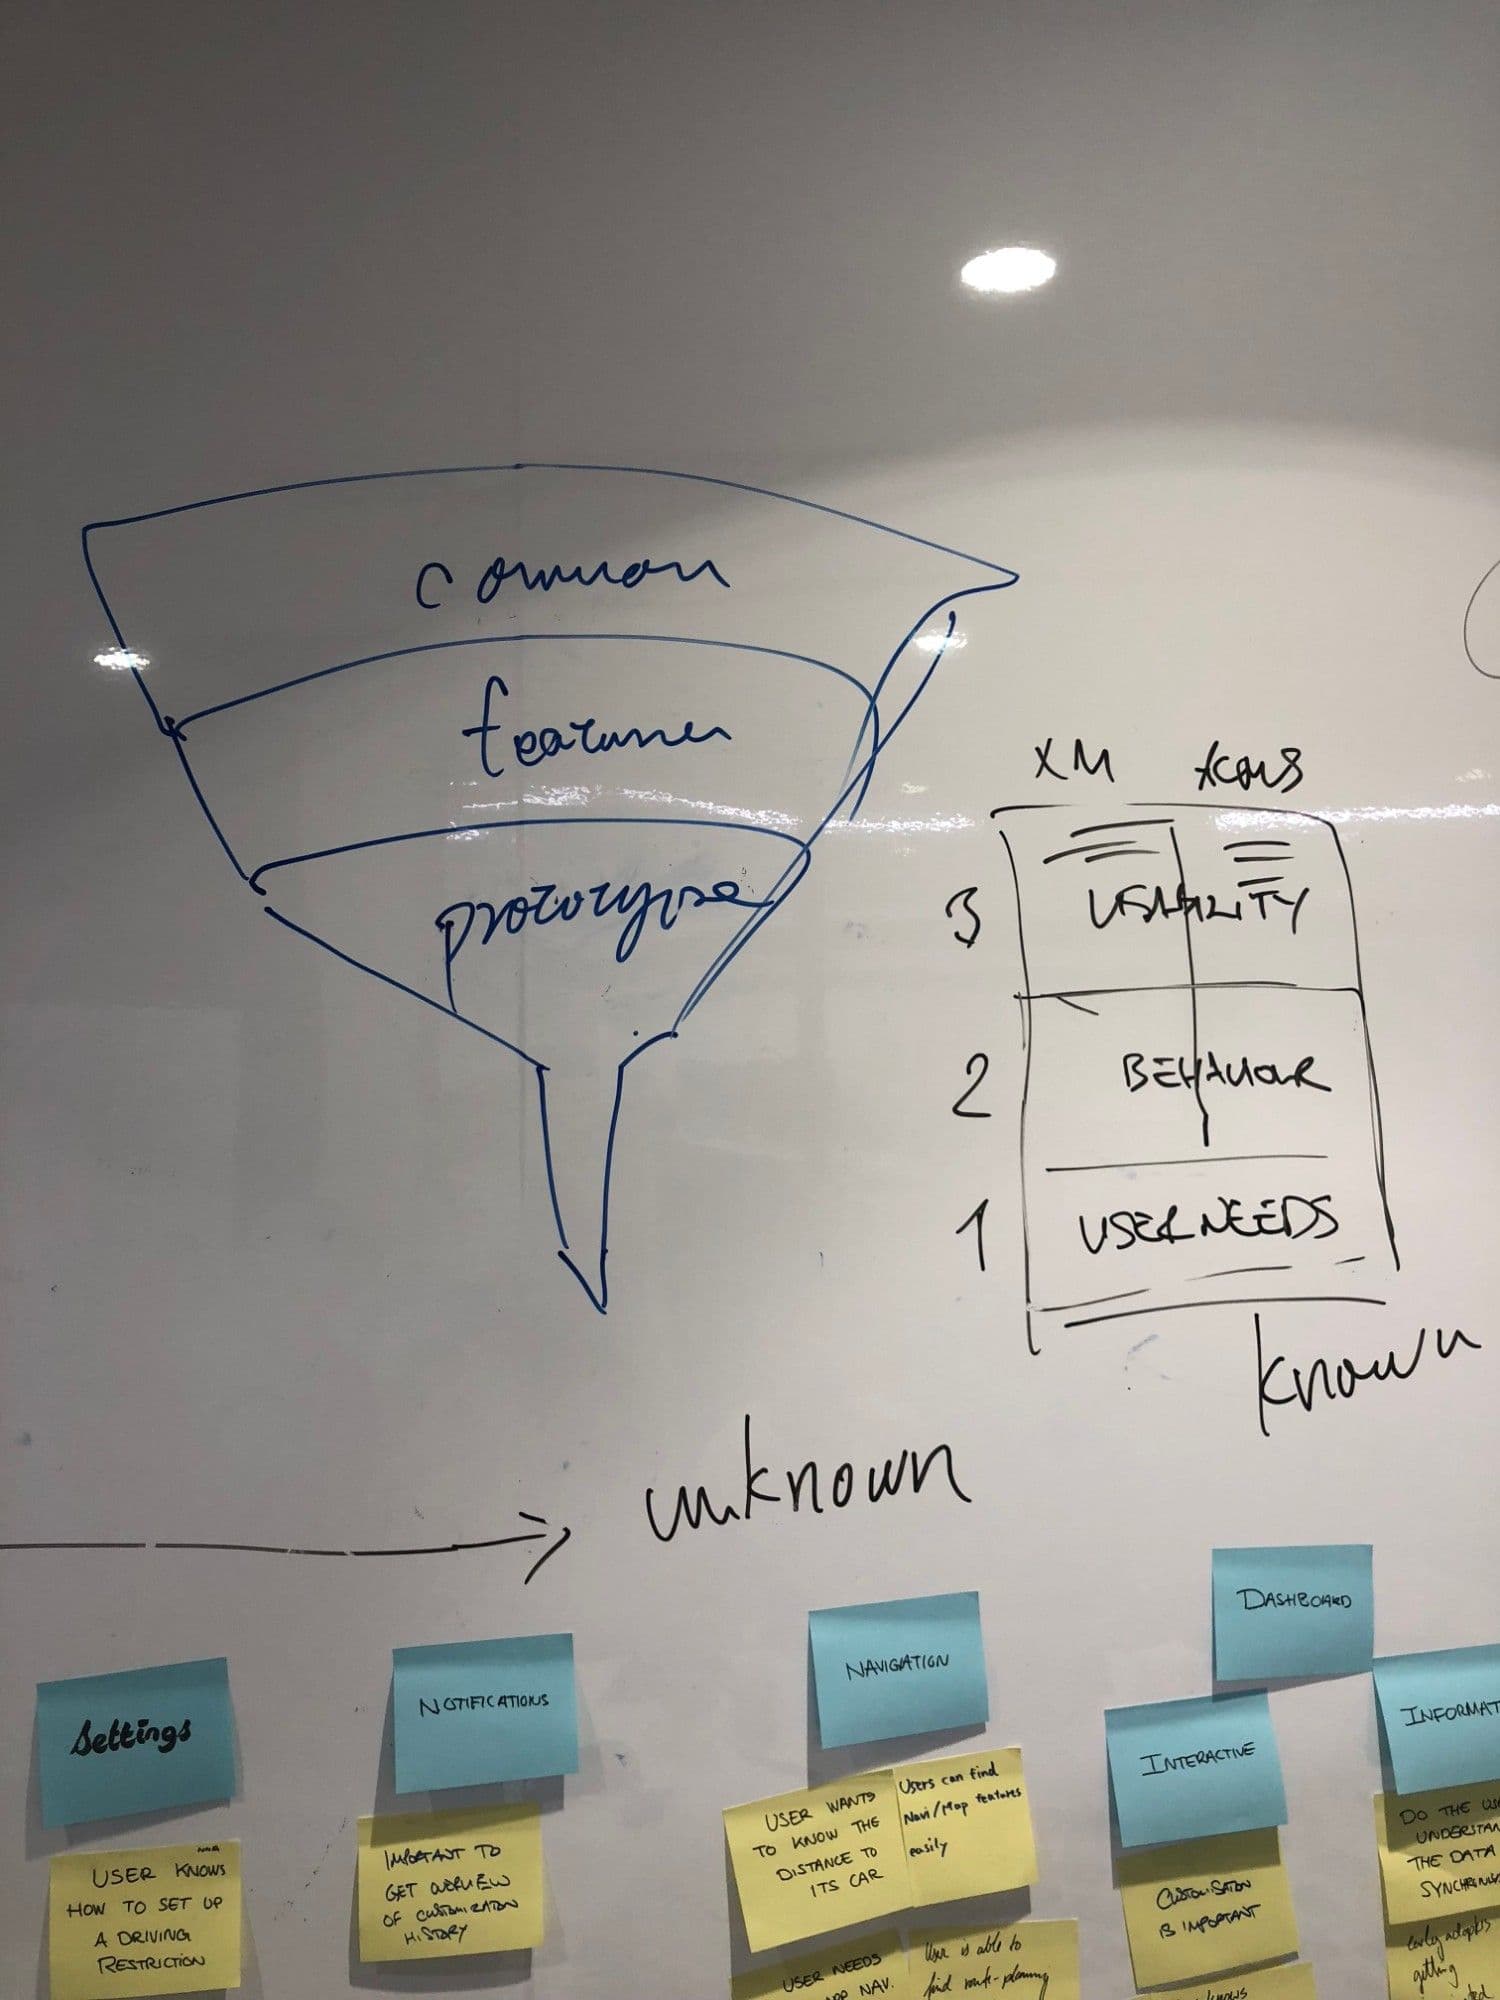
I mapped the features the brands required against the features the mechanical engineers could actually provide, and reviewed UI and branding proposals, user journey maps and the app architecture. Interactive prototypes went to the stakeholders, and I travelled to Austin and Detroit for workshops to align the teams of the different countries.
Two workshops then brought all 42 stakeholders together to confront their own prototypes with my synthesis of them. The discussion led to minor changes, and consolidated the international vision of the app.
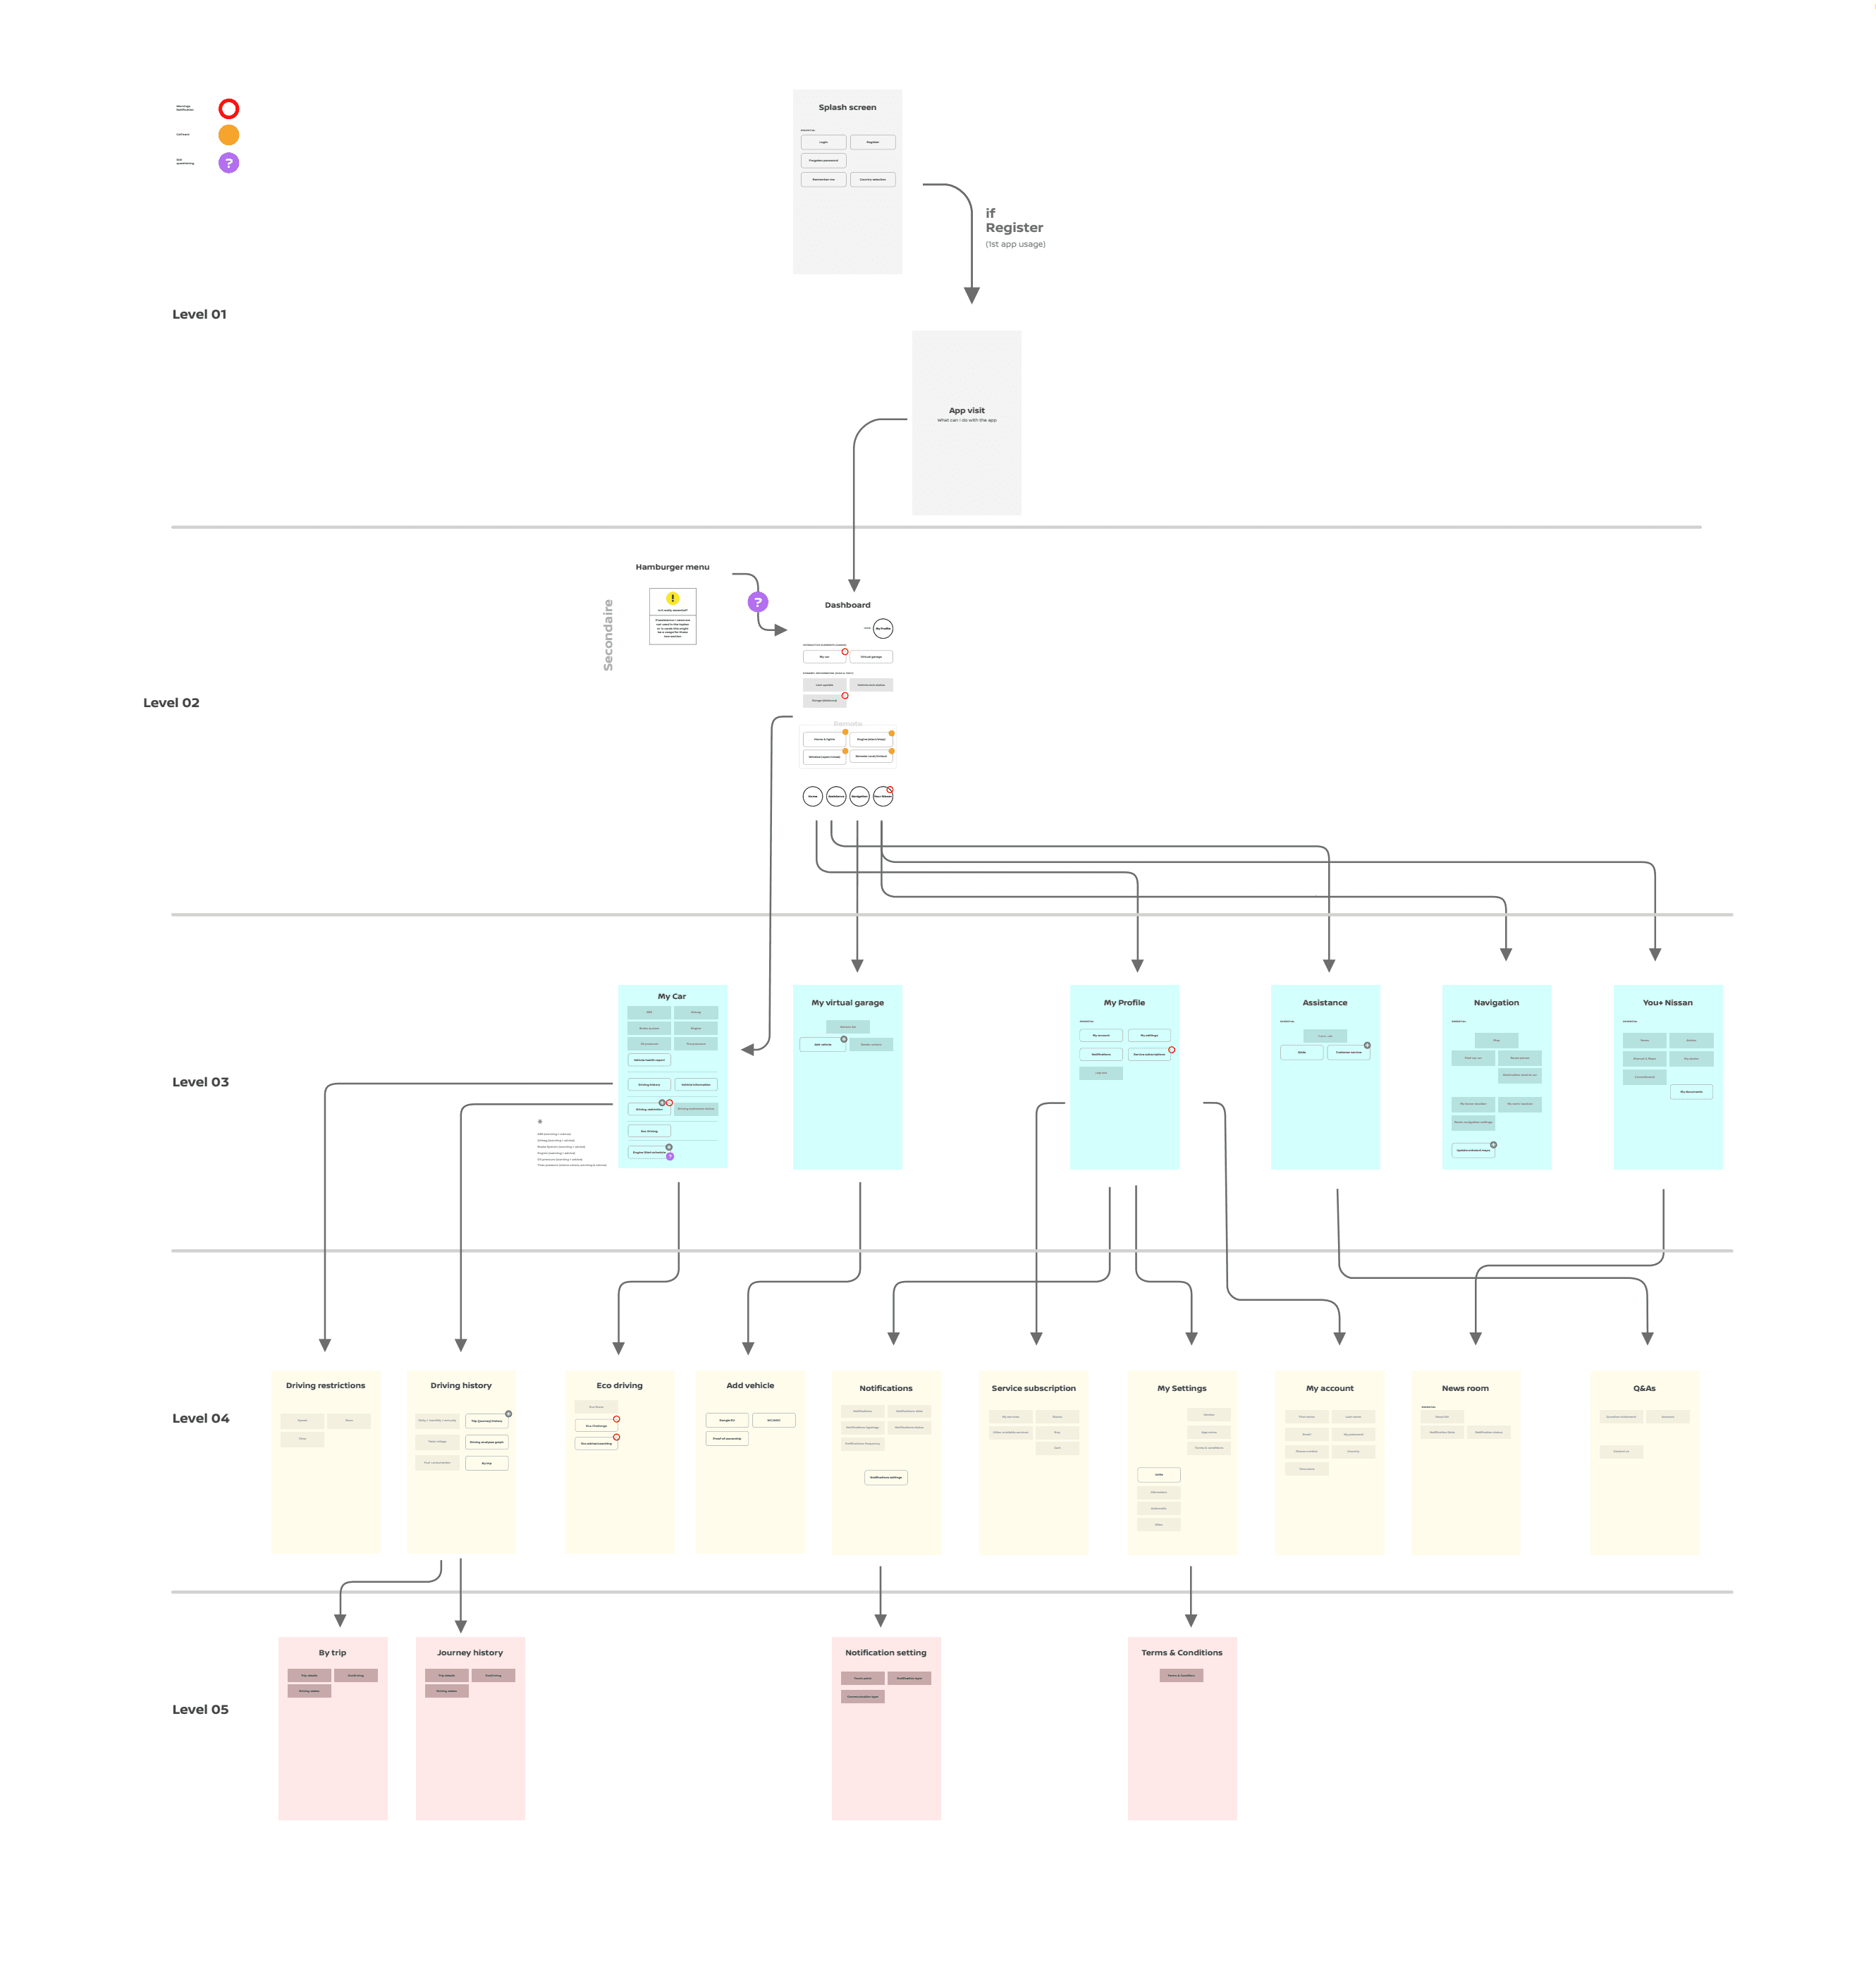
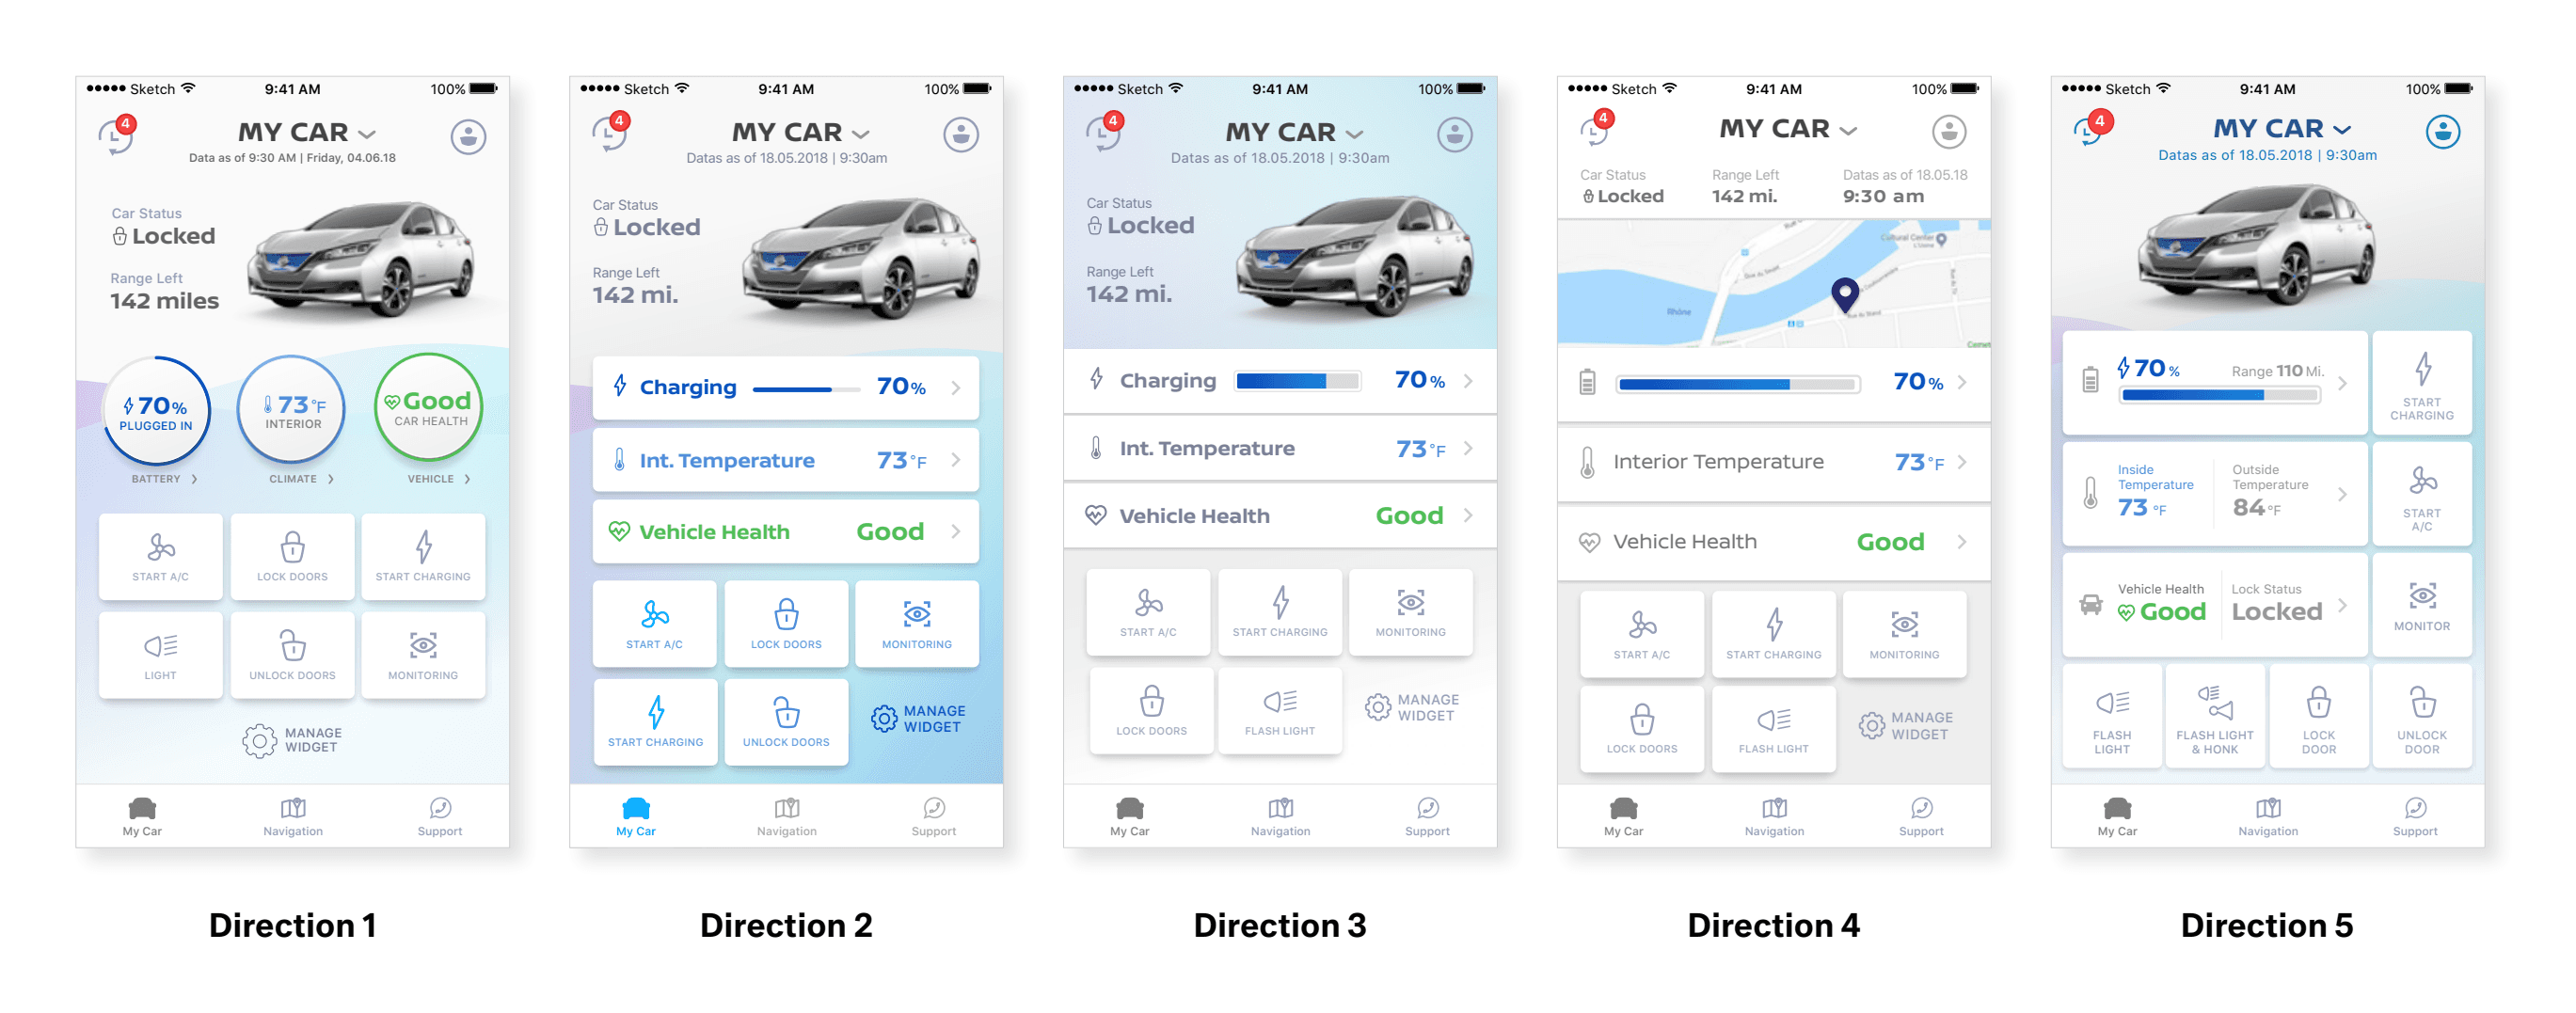
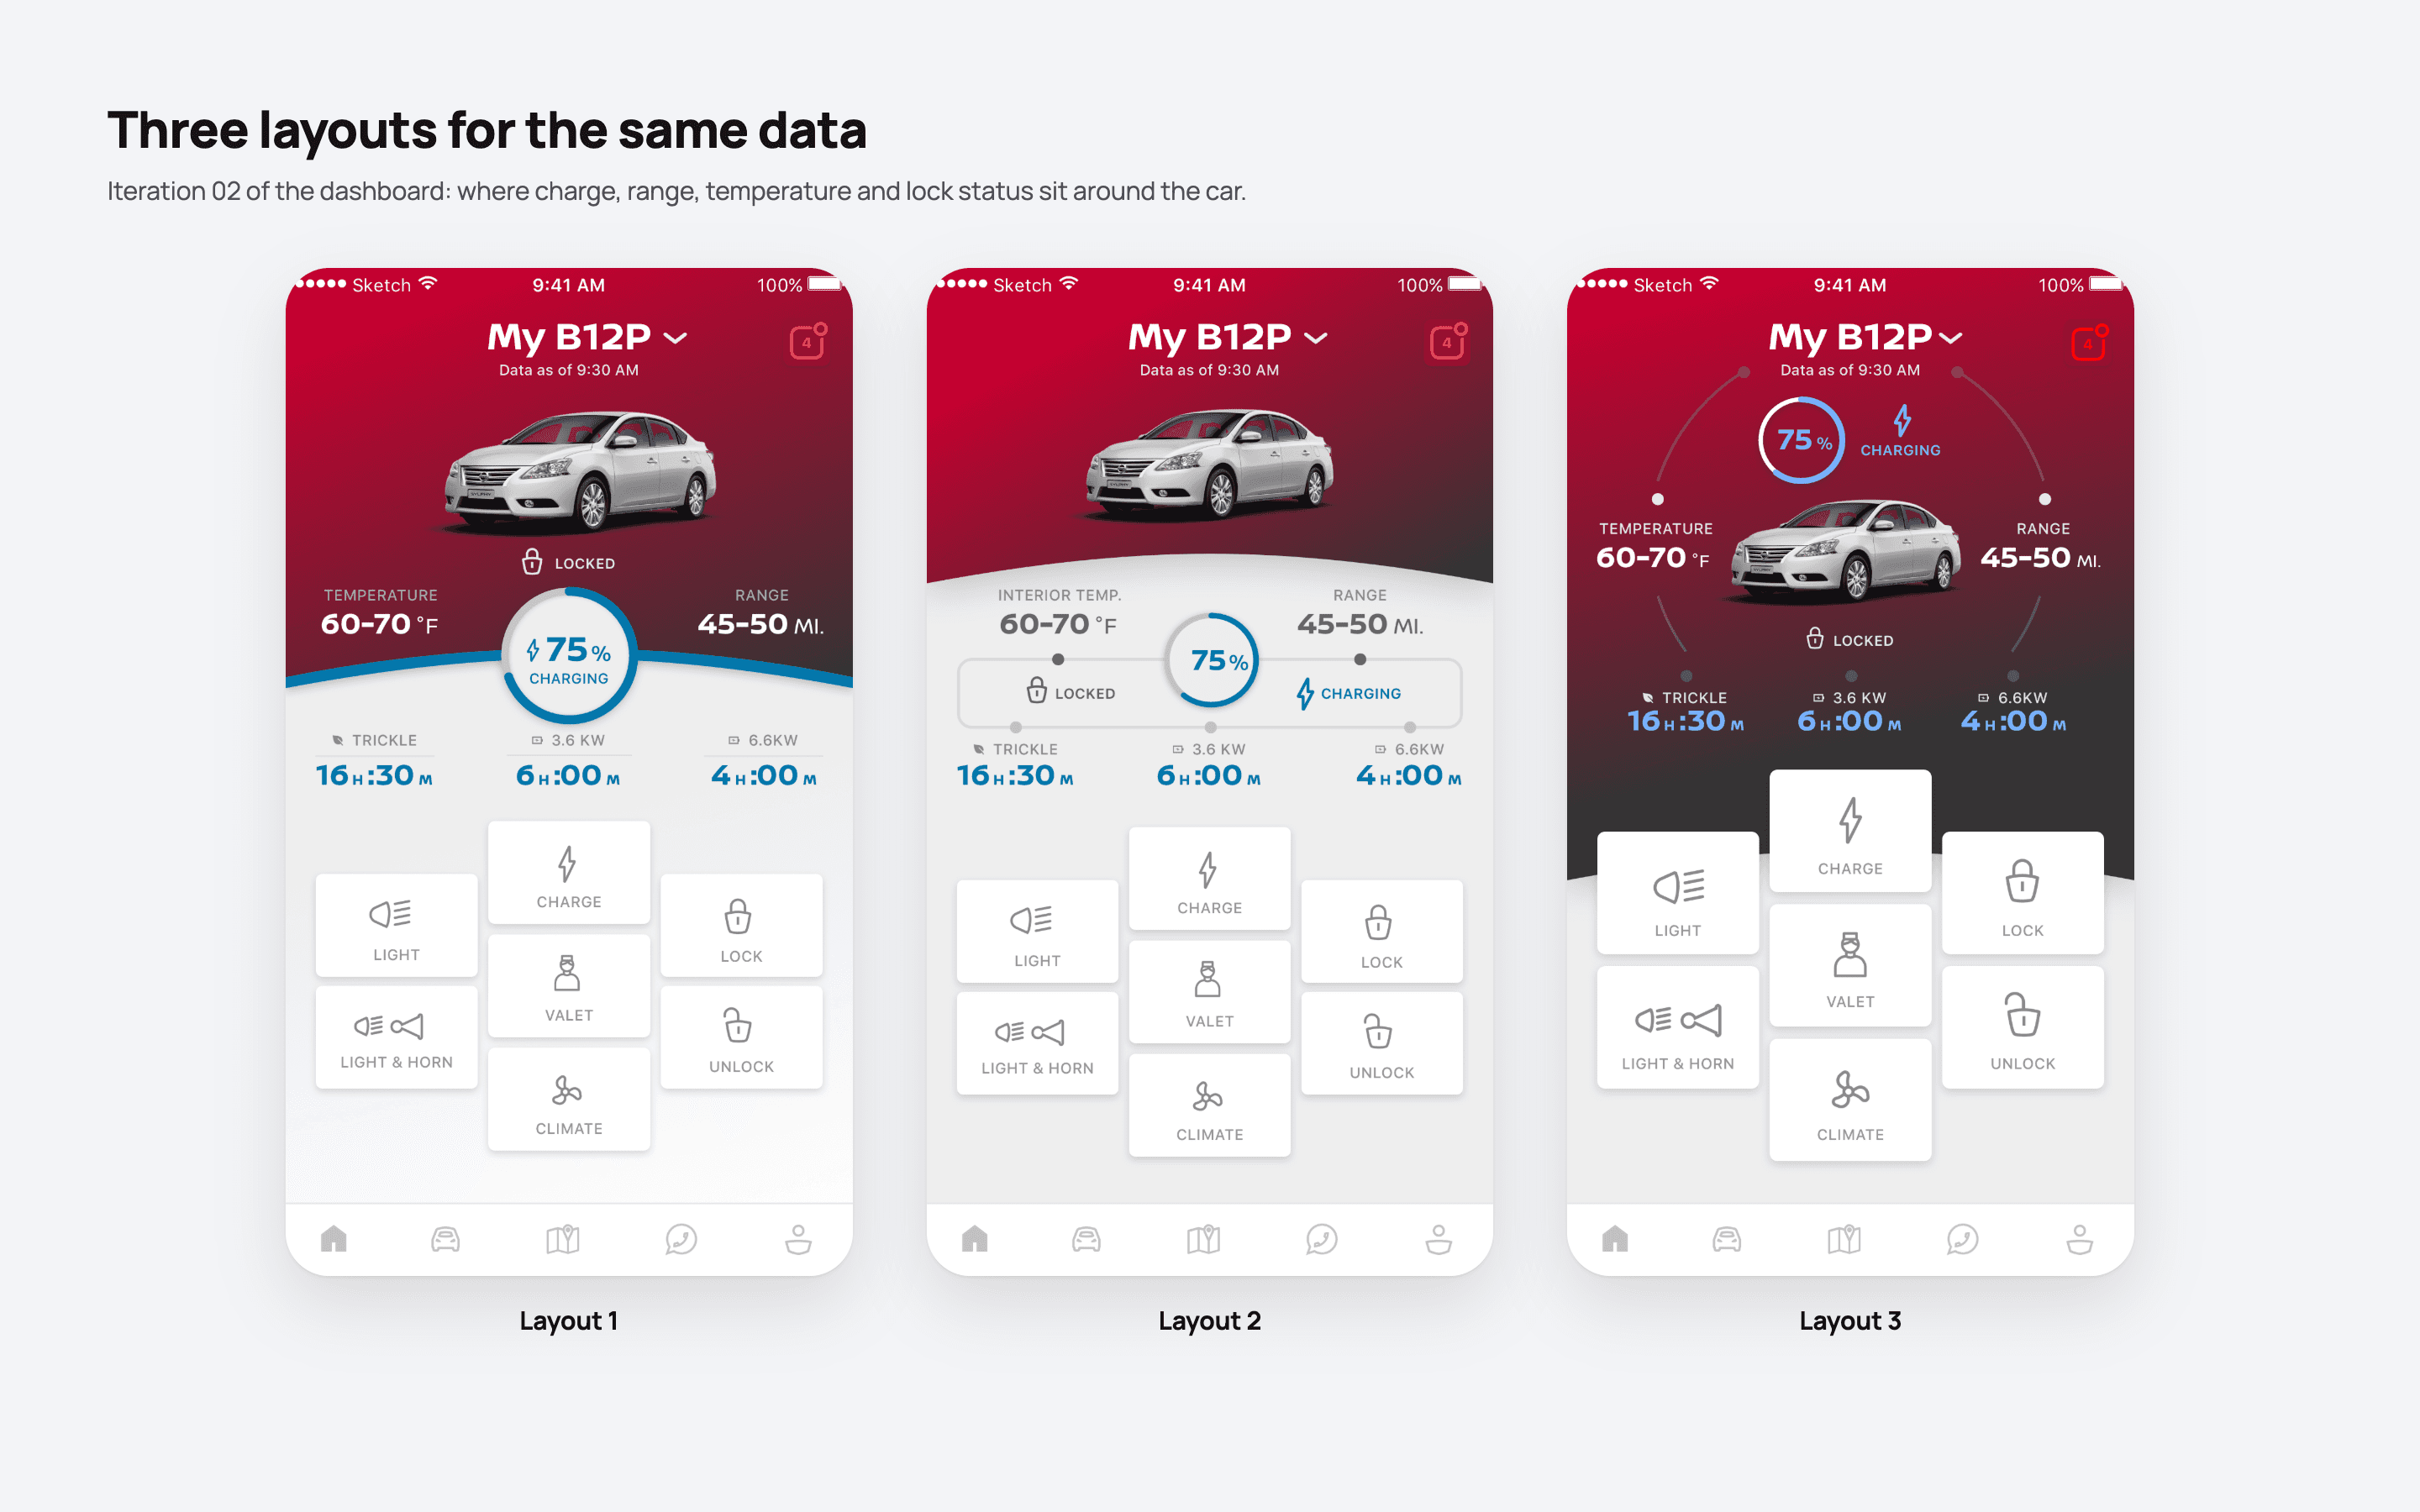
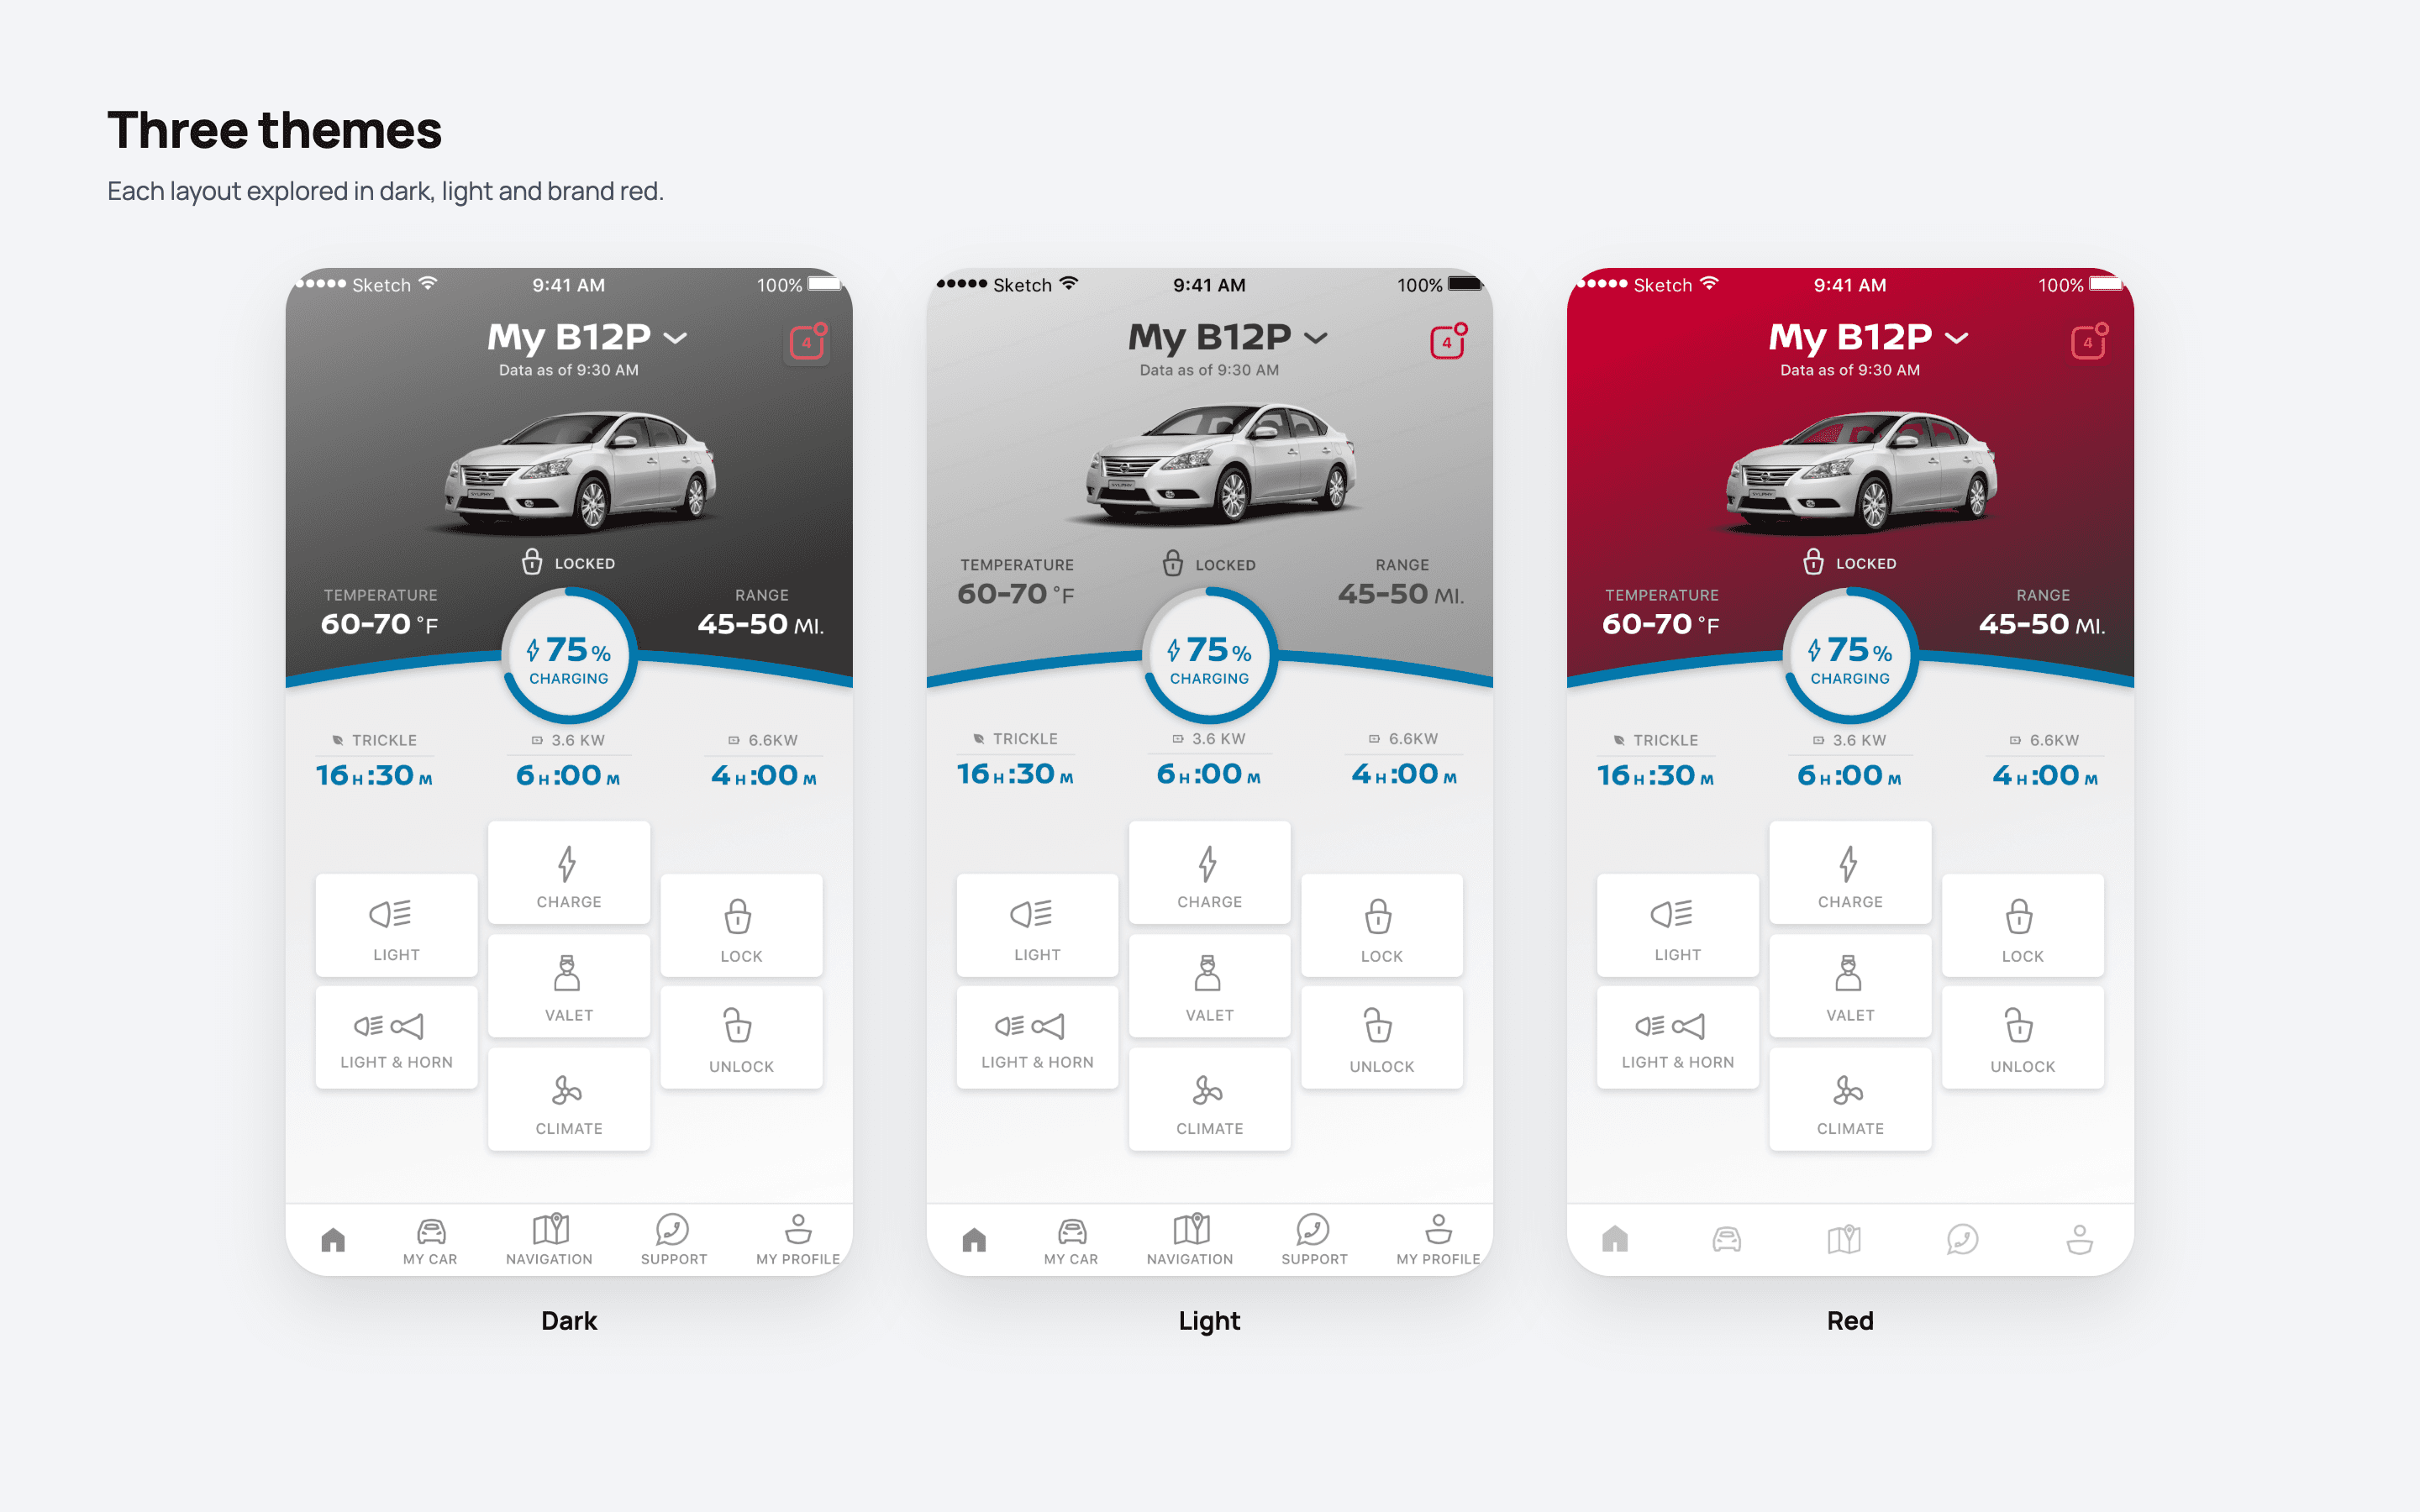
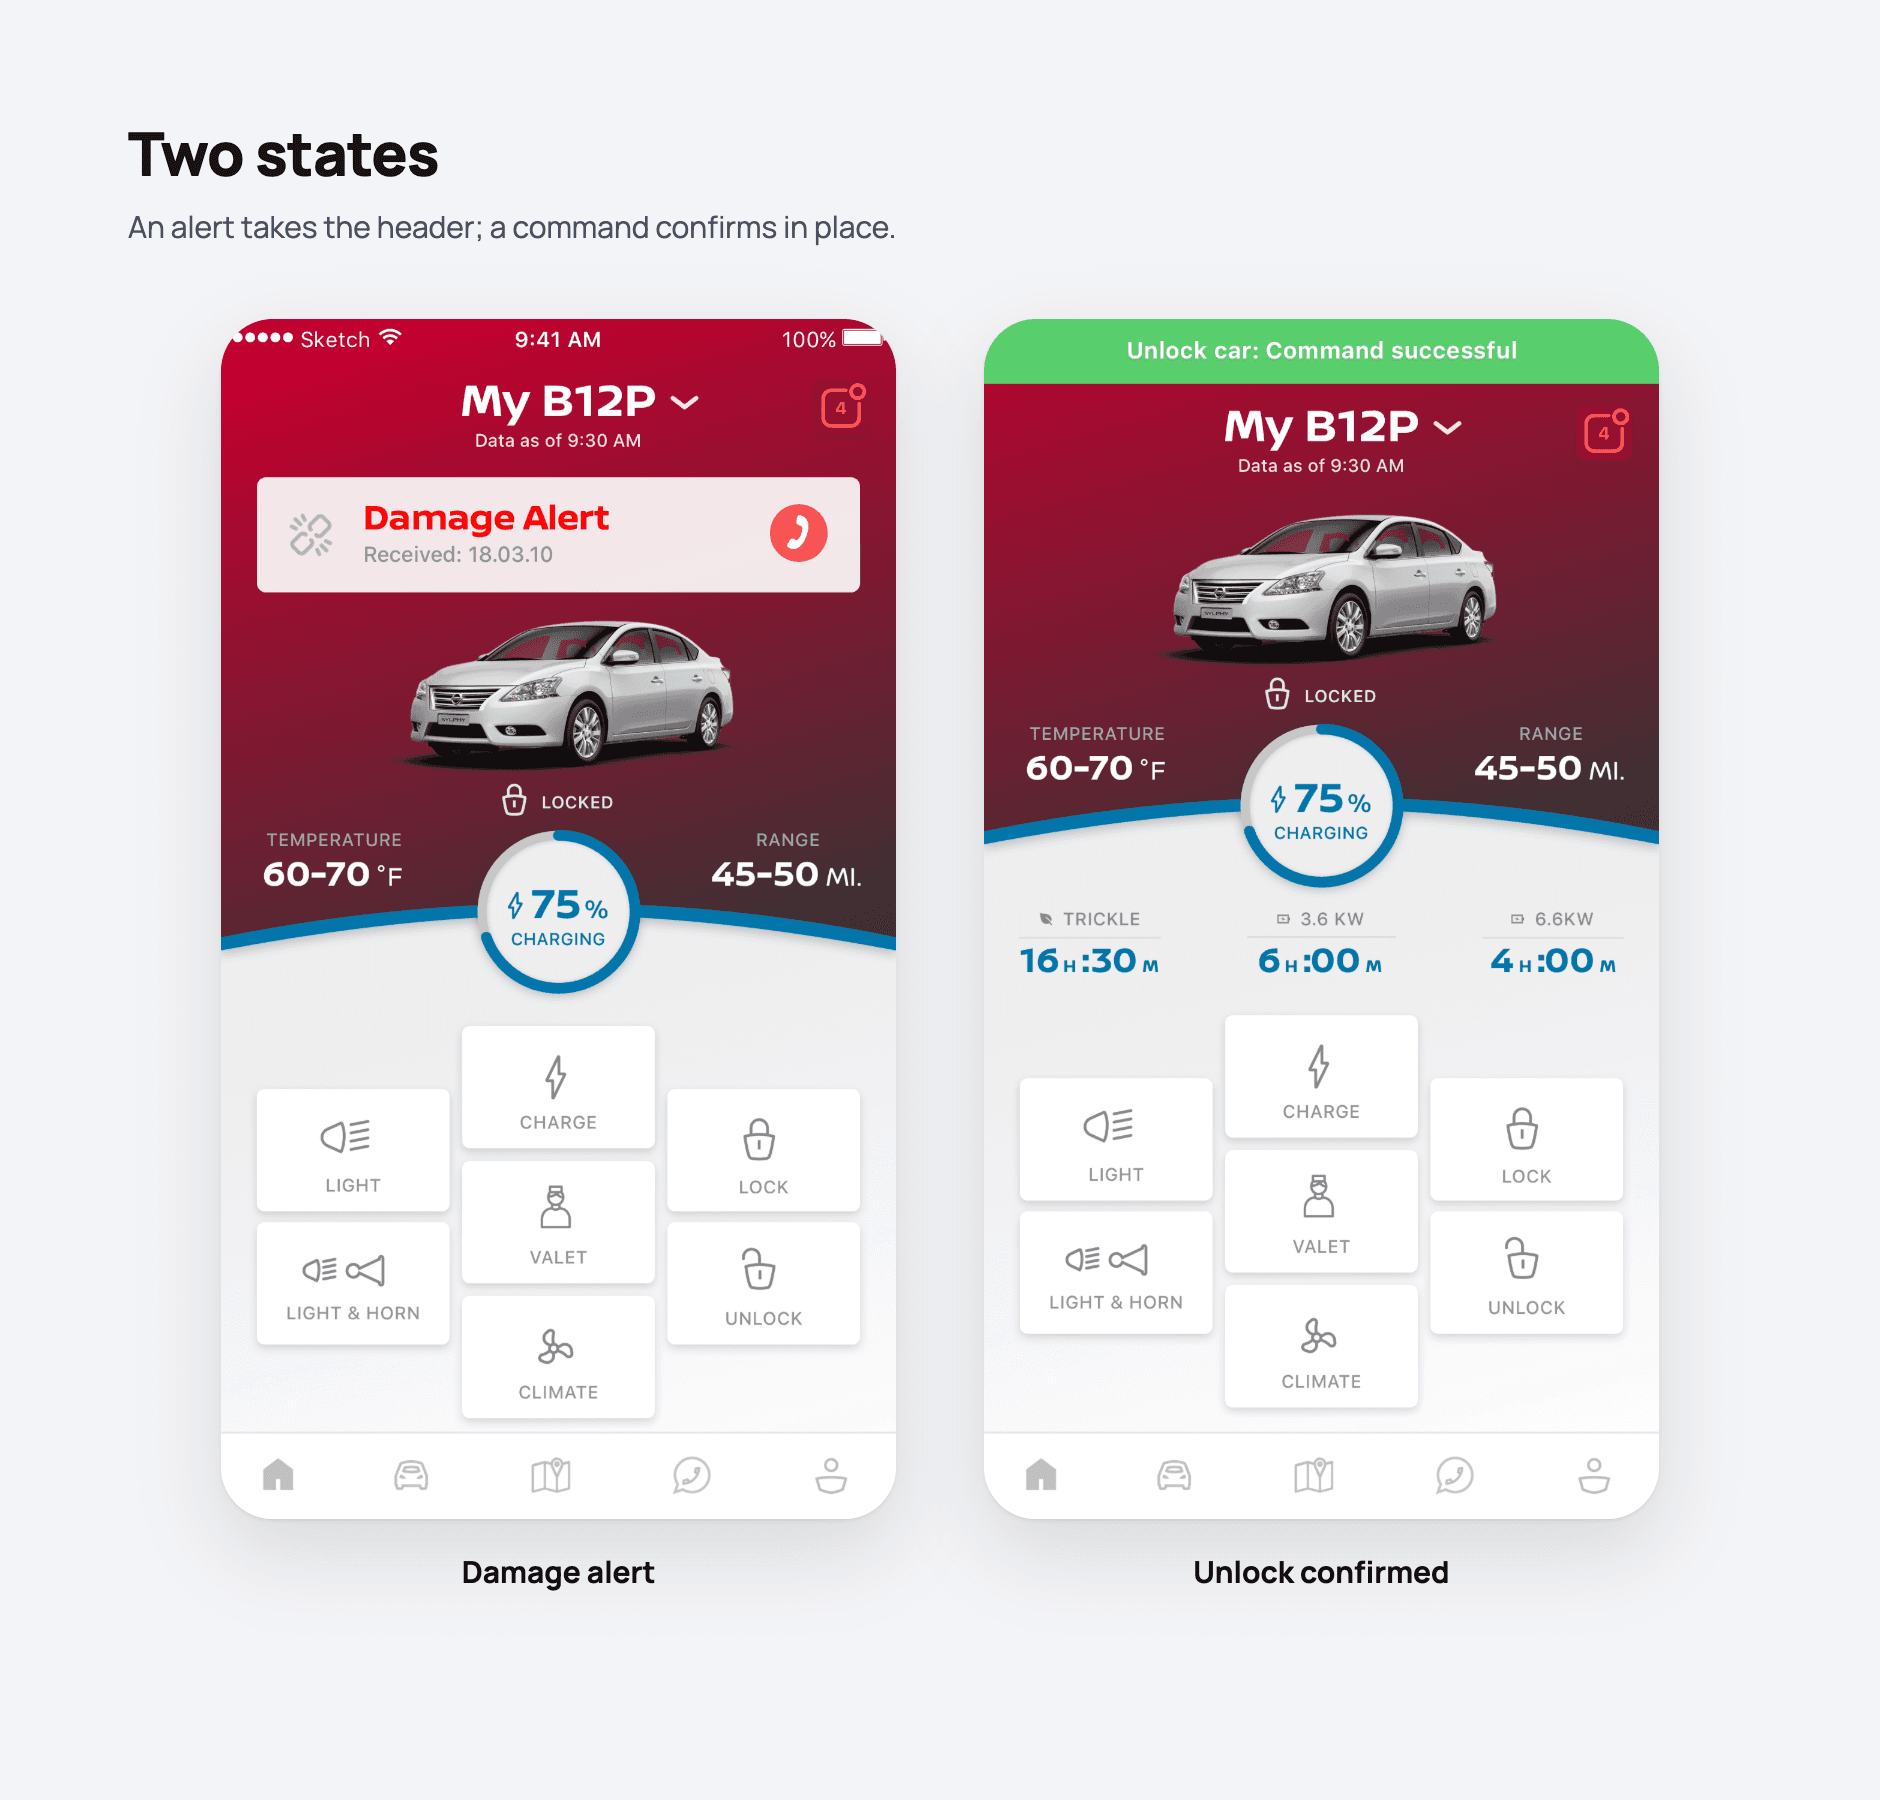
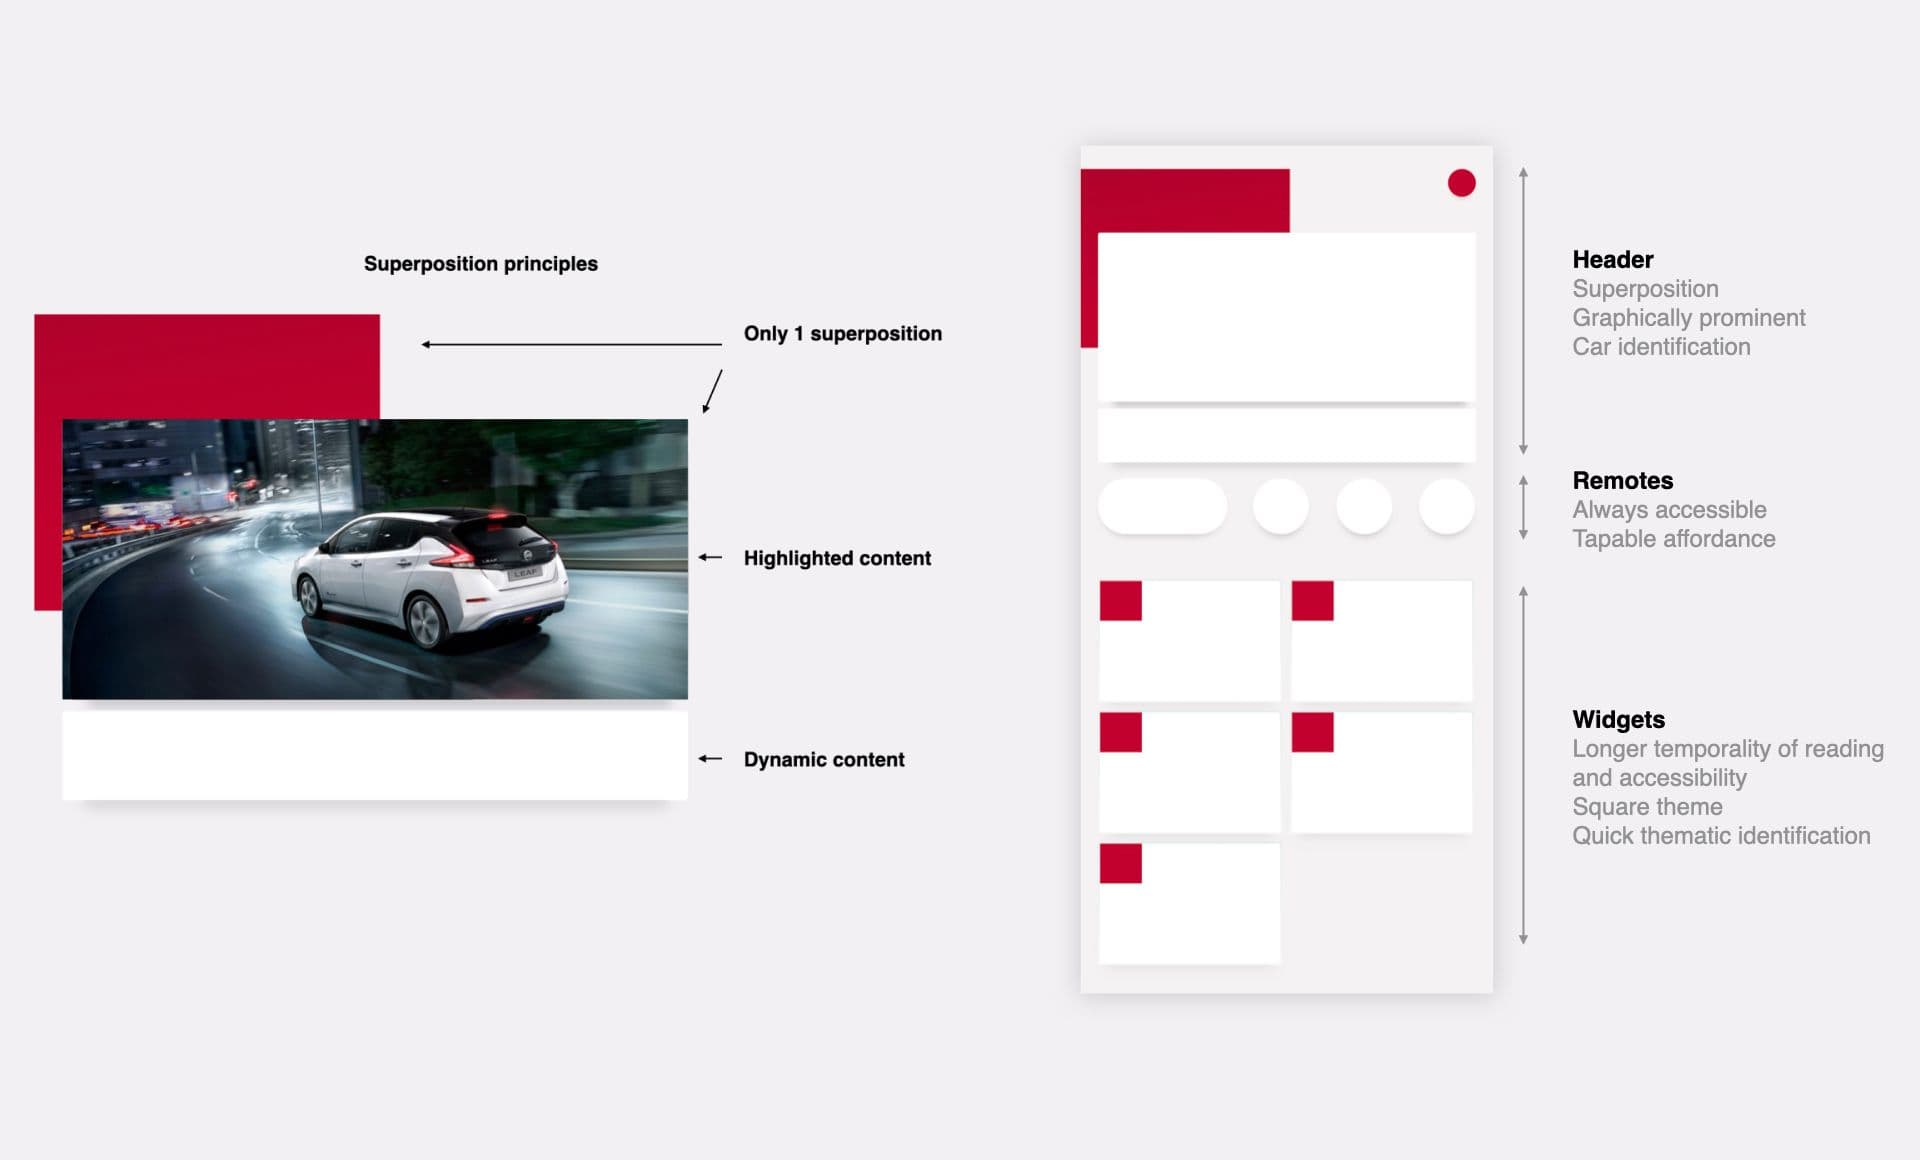
Only one superposition per screen: highlighted content on top, dynamic content below.
Superposed and graphically prominent; identifies the car.
Always accessible, with a clear tap affordance.
Built for longer reading and accessibility, square themes, and quick thematic identification.
76%Task success
Of drivers completed all 6 tasks in tests.
No store rating: the app was withdrawn when the digital services were split between regions.
05
Prototypes in code, and the data behind them.
I coded all the prototypes that were not made in Prott or Sketch.
I ran workshops with the mechanical engineers to learn how to get each piece of data, and what they thought was realistic to show in the app.
On Nissan Box, I designed the app's design system: components and tokens, documented in Figma, and prepared for my engineering colleagues and for AI agents, so that design and code start from the same source.
06
More drivers on the apps.
Thermal and electric drivers each see what matters to them in one app, shaped with 254 drivers in three countries: 76% completed all 6 test tasks.
More drivers on its apps: a 12% increase in users, a team result with the ACMS teams.
+12%Users
My work with the ACMS teams on two new Nissan applications contributed to a 12% increase in users.
I would run workshops where drivers build prototypes together with us, with simple paper, tape, scissors and markers, to let their own initiative emerge.